Cytkit | Honeychrome
 Honeychrome
- Overview and Installation
- Acquire Data
- Spectral Analysis
- AutoSpectral in Honeychrome
- Conventional Analysis
- Manipulate Plots and Gates
- Reports, Exports & Sample Comparison
- Programming and Plugins
Conventional Analysis
Although Honeychrome was primarily intended for spectral cytometry, you can use it just as easily for conventional cytometry, because, in fact, conventional cytometry is actually just a kind of spectral cytometry. You can use single stain controls, or do manual compensation (without single stained controls) or just ignore compensation, by assigning label names to the relevant instrument channels.
You must however bear one thing in mind. Do NOT do your analysis in the Raw Data tab! The instrument has a set of channels, which you will see in the Raw Data tab. But you are measuring a set of fluorescent labels, which you want to see in the Unmixed Data tab. You must use the Spectral Process tab to define the relationship between the instrument channels and the fluorescent labels, thus controlling what you see in the Unmixed Data tab:
- either use single stain controls in exactly the same way as in the Spectral Analysis workflow,
- or use the Spectral Model Editor to assign labels to relevant instrument channels.
Below we give an example of the latter (on Tregs), with manual compensation.
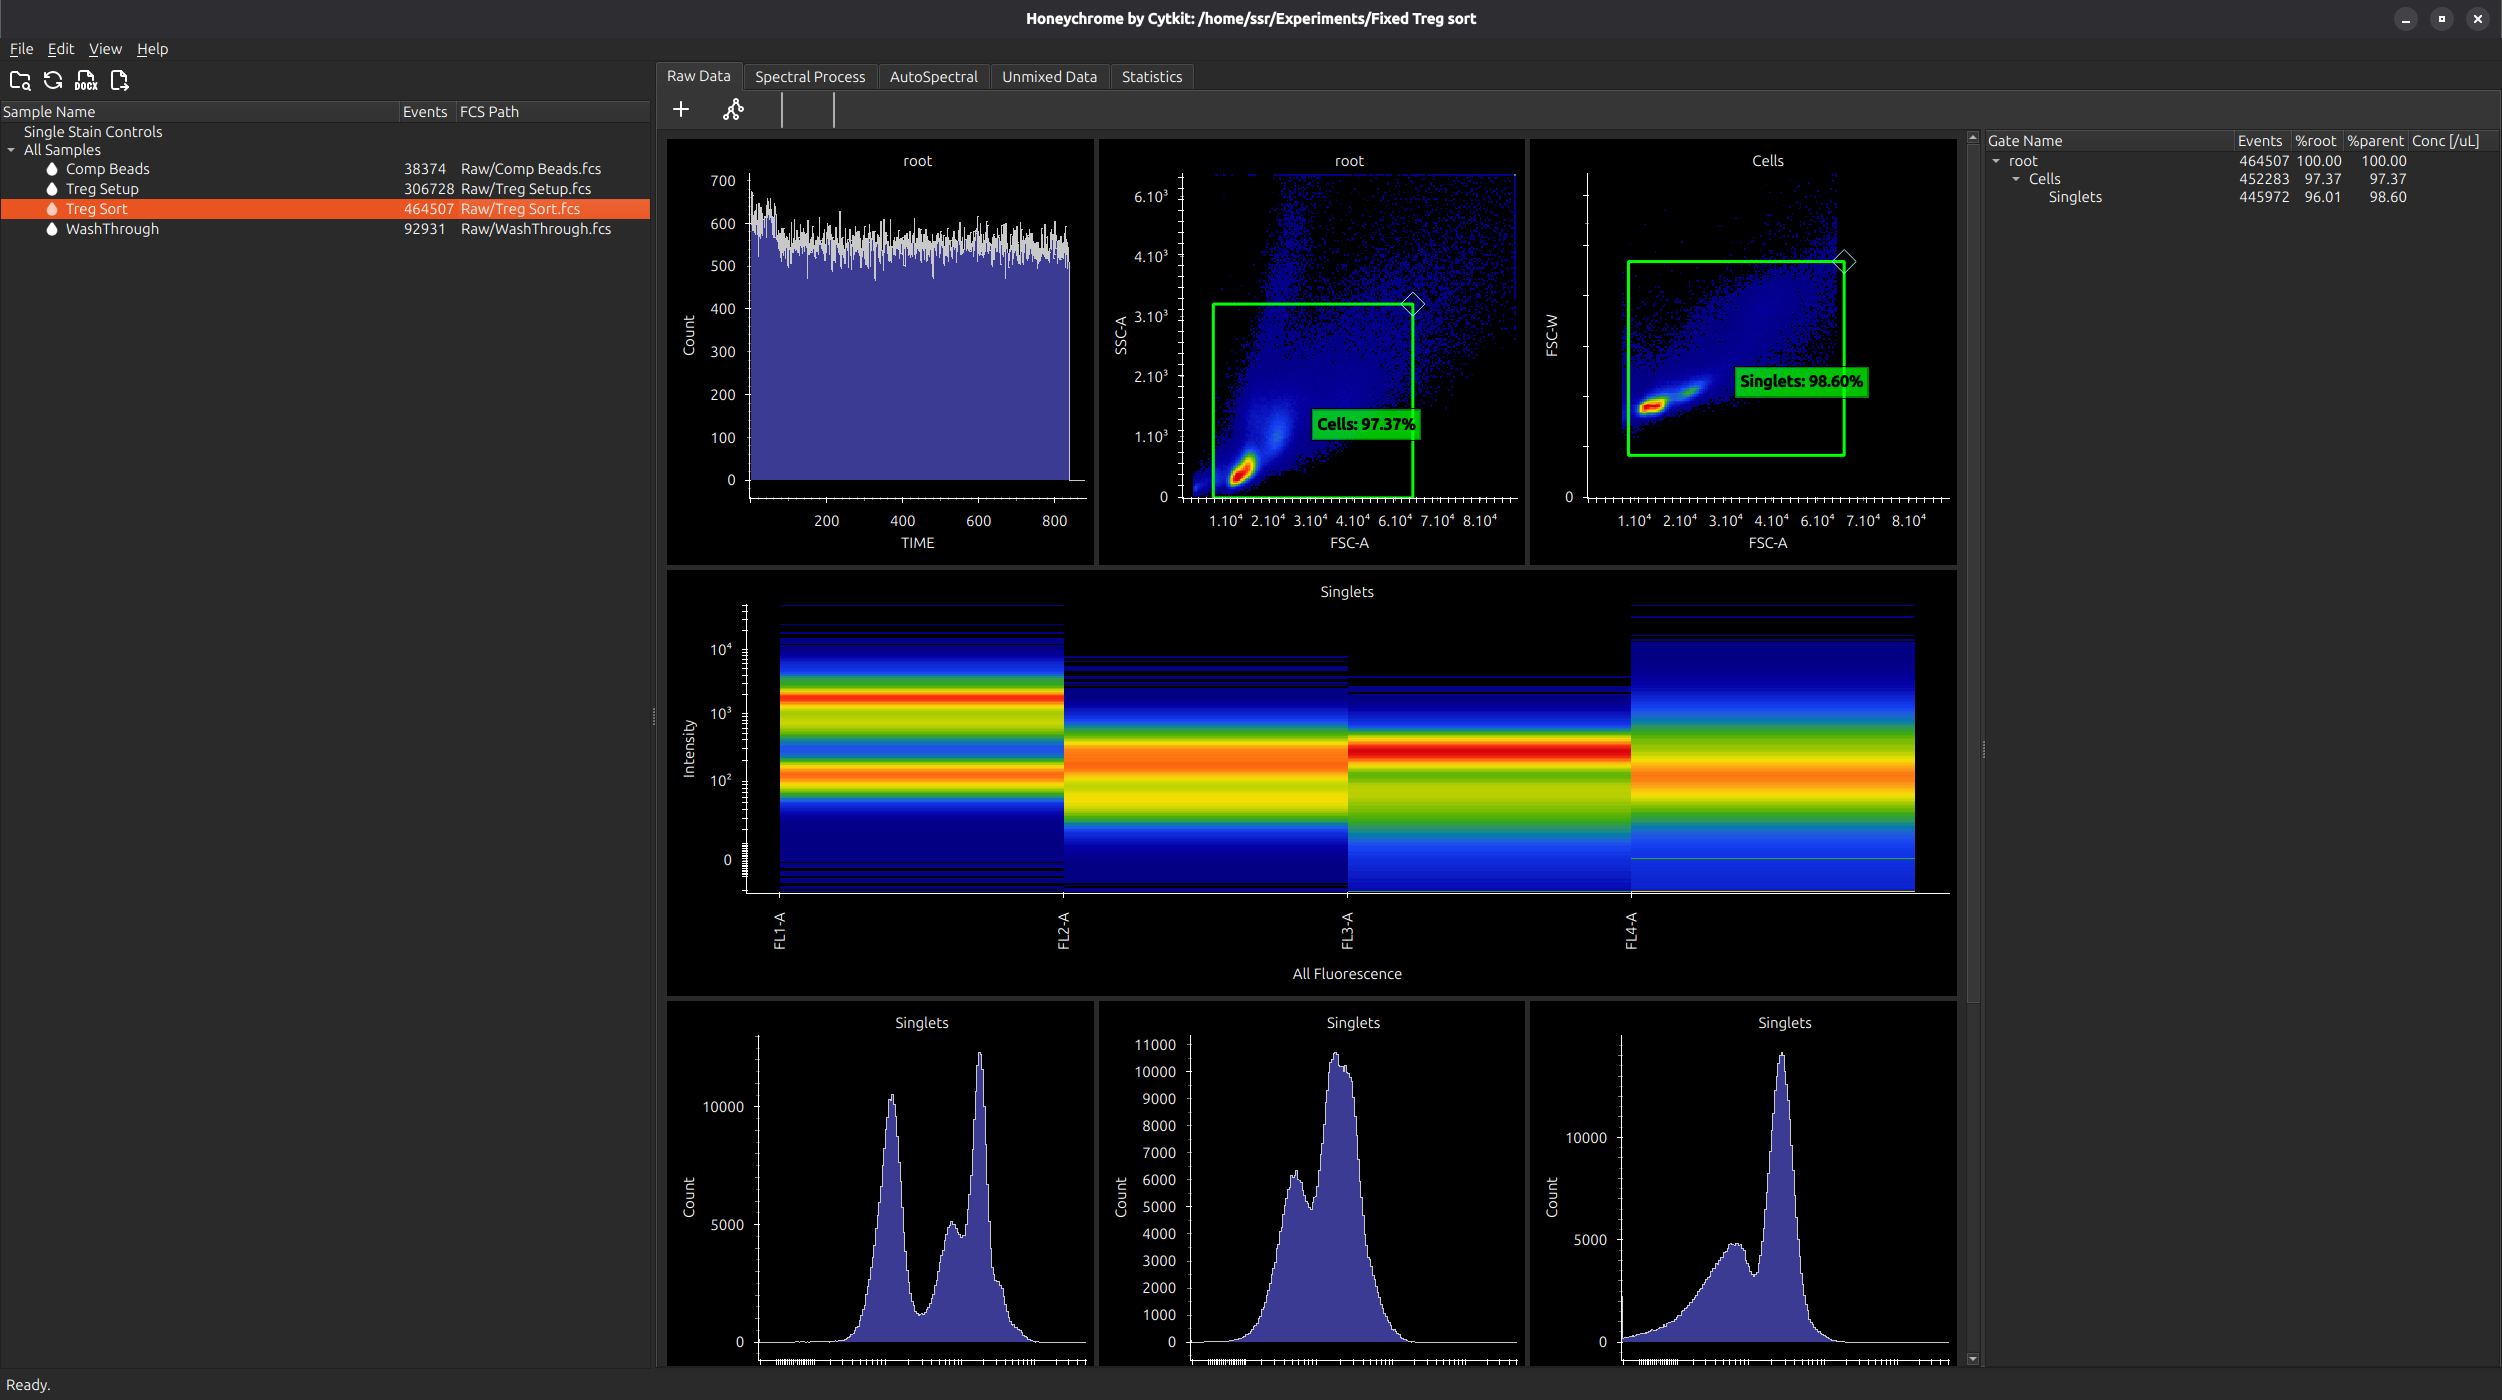
Import your data
First import your data (menu File > Import FCS Files). In the case below, we have a few Treg data files, with no single stained controls. You will see a summary of data in all instrument channels.
Use the Spectral Model Editor to assign labels to relevant instrument channels
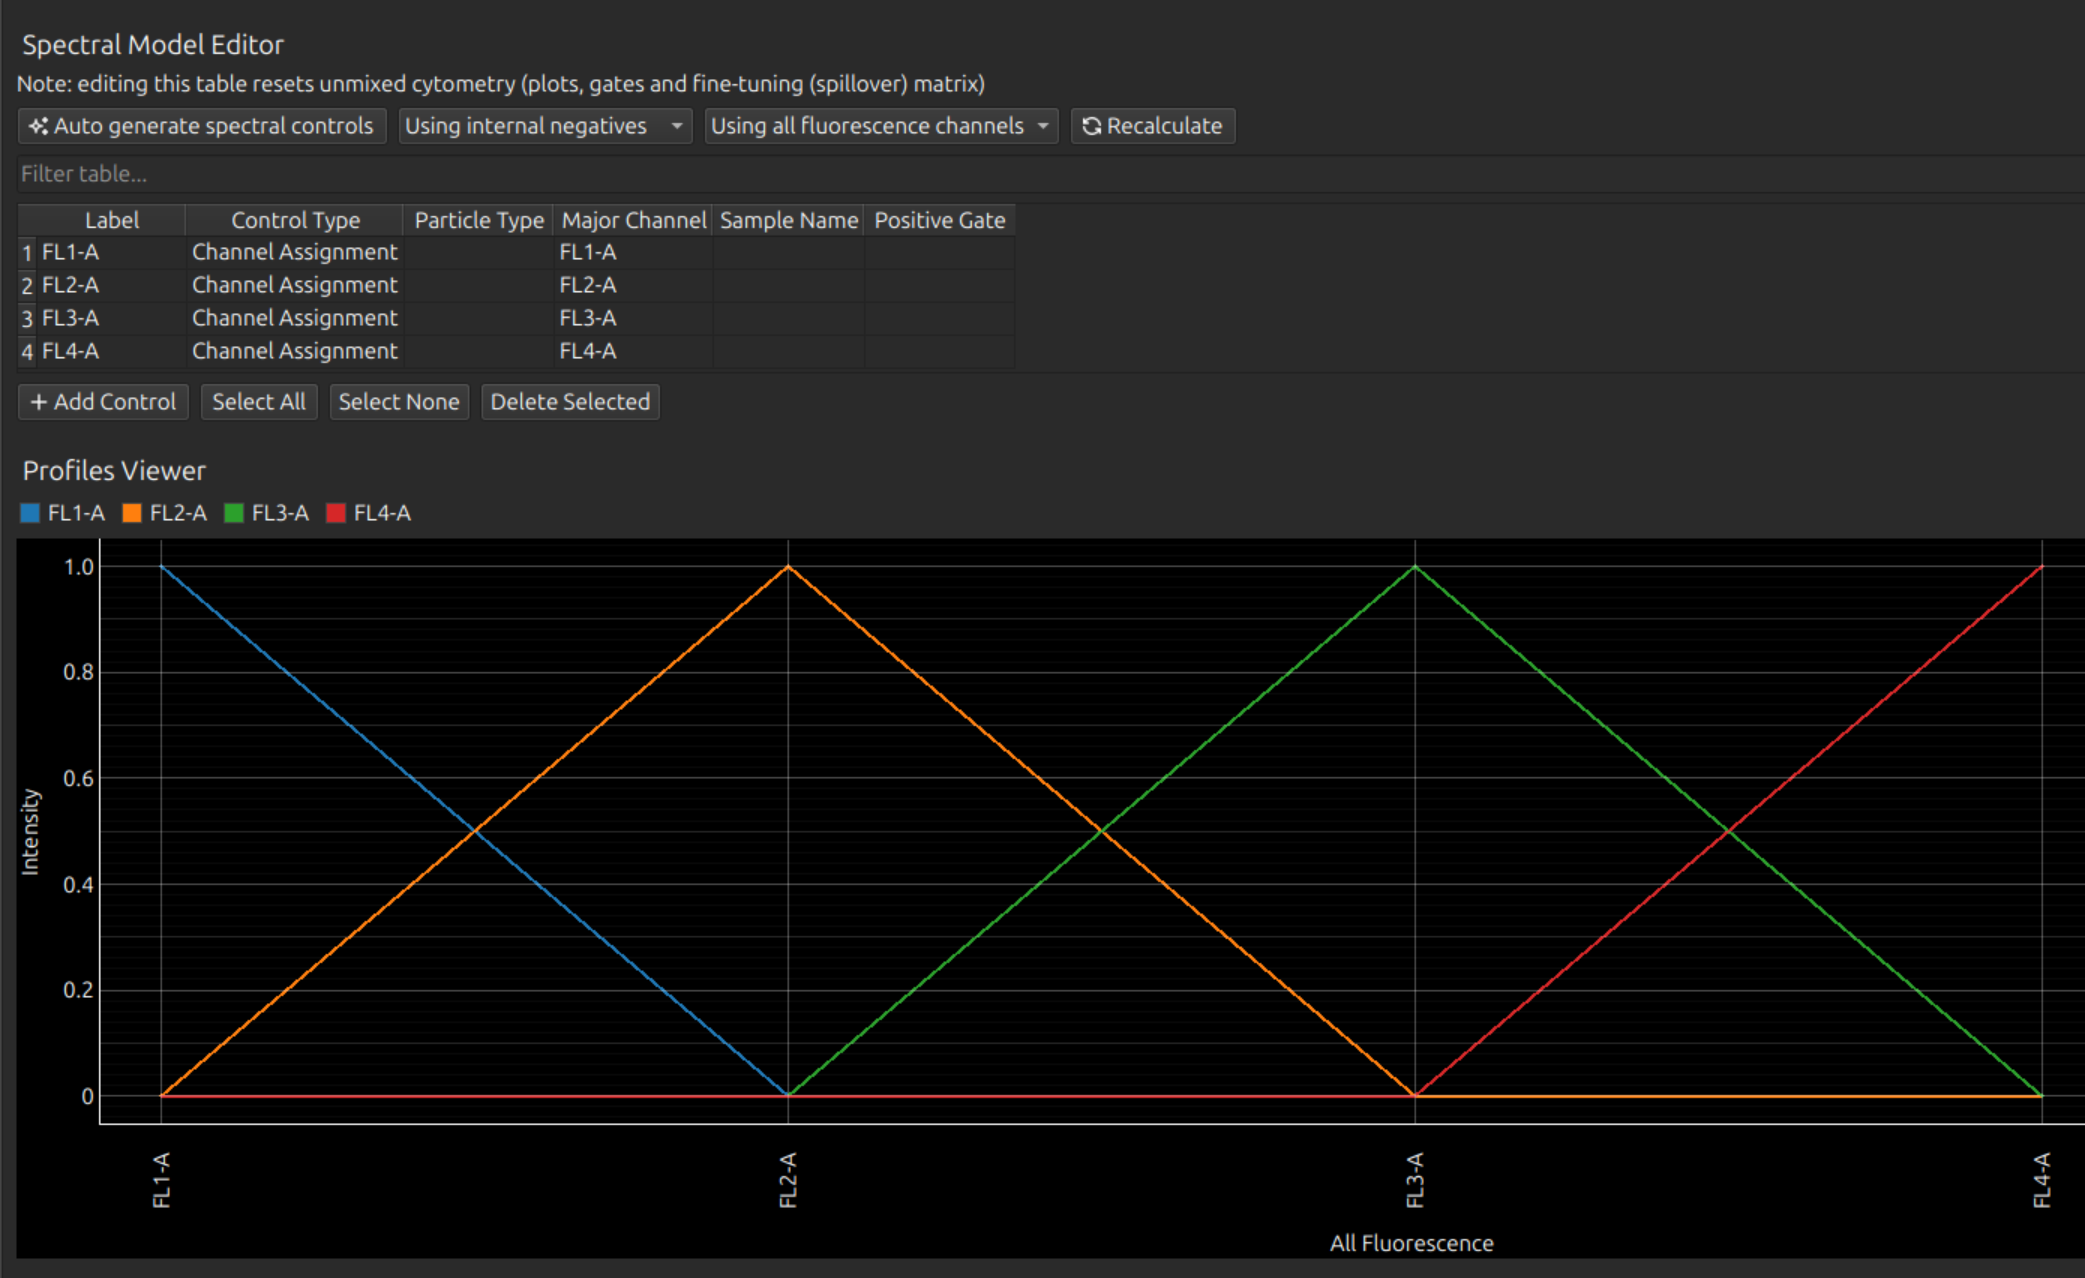
In the Spectral Process tab, under Spectral Model Editor, either add lines one-by-one: for each label, type the label name, select Channel Assignment as the Control Type, and select the relevant instrument channel for each flurophore. Or add all at once by clicking Auto Generate Spectral Controls.
The assignment of channels in this way is equivalent to using a delta function as a spectral profile, as you can see from the Profiles Viewer.
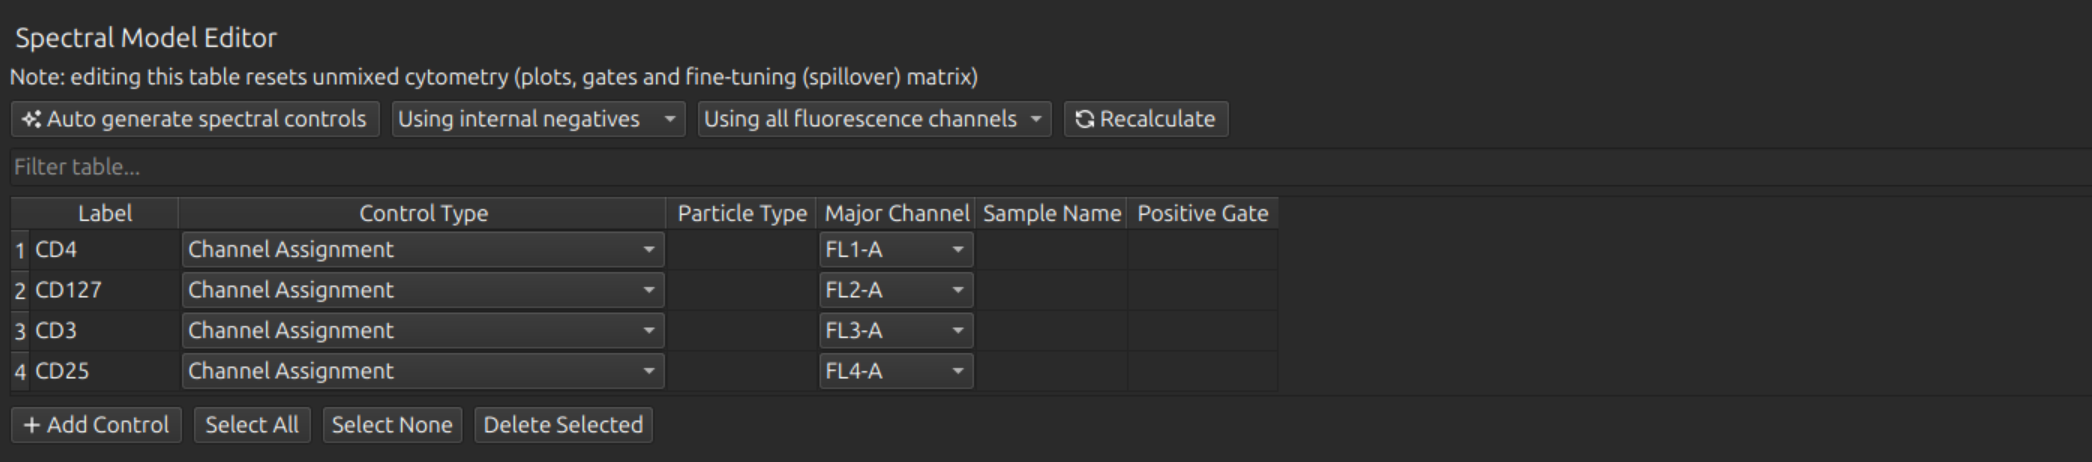
We will then rename our labels, in this case to CD4 (on FL1, the FITC channel), CD127 (on Fl2, the PE channel), CD3 (on FL3, the PerCP channel), and CD25 (on FL4, the APC channel).
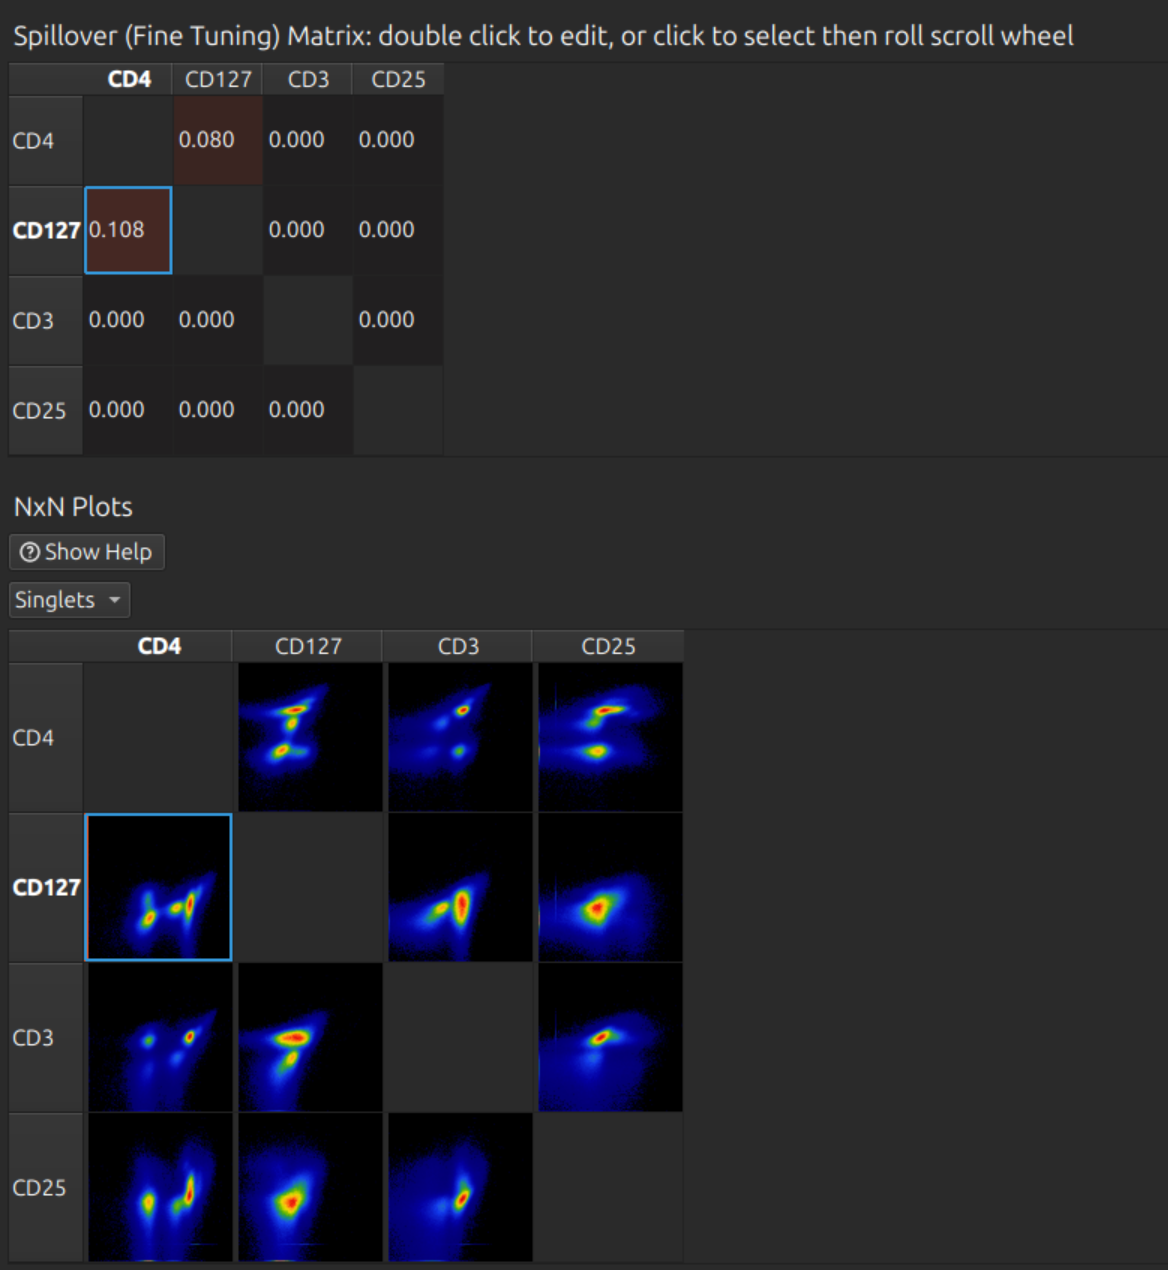
Manual compensation
Scroll down to the spillover and NxN plots matrices. In this case a few percent compensation is required between the first two channels (FITC to PE and vice versa). You can click on the relevant cell to select it, then roll the mouse wheel. Repeat for any other cells in the matrix as desired.
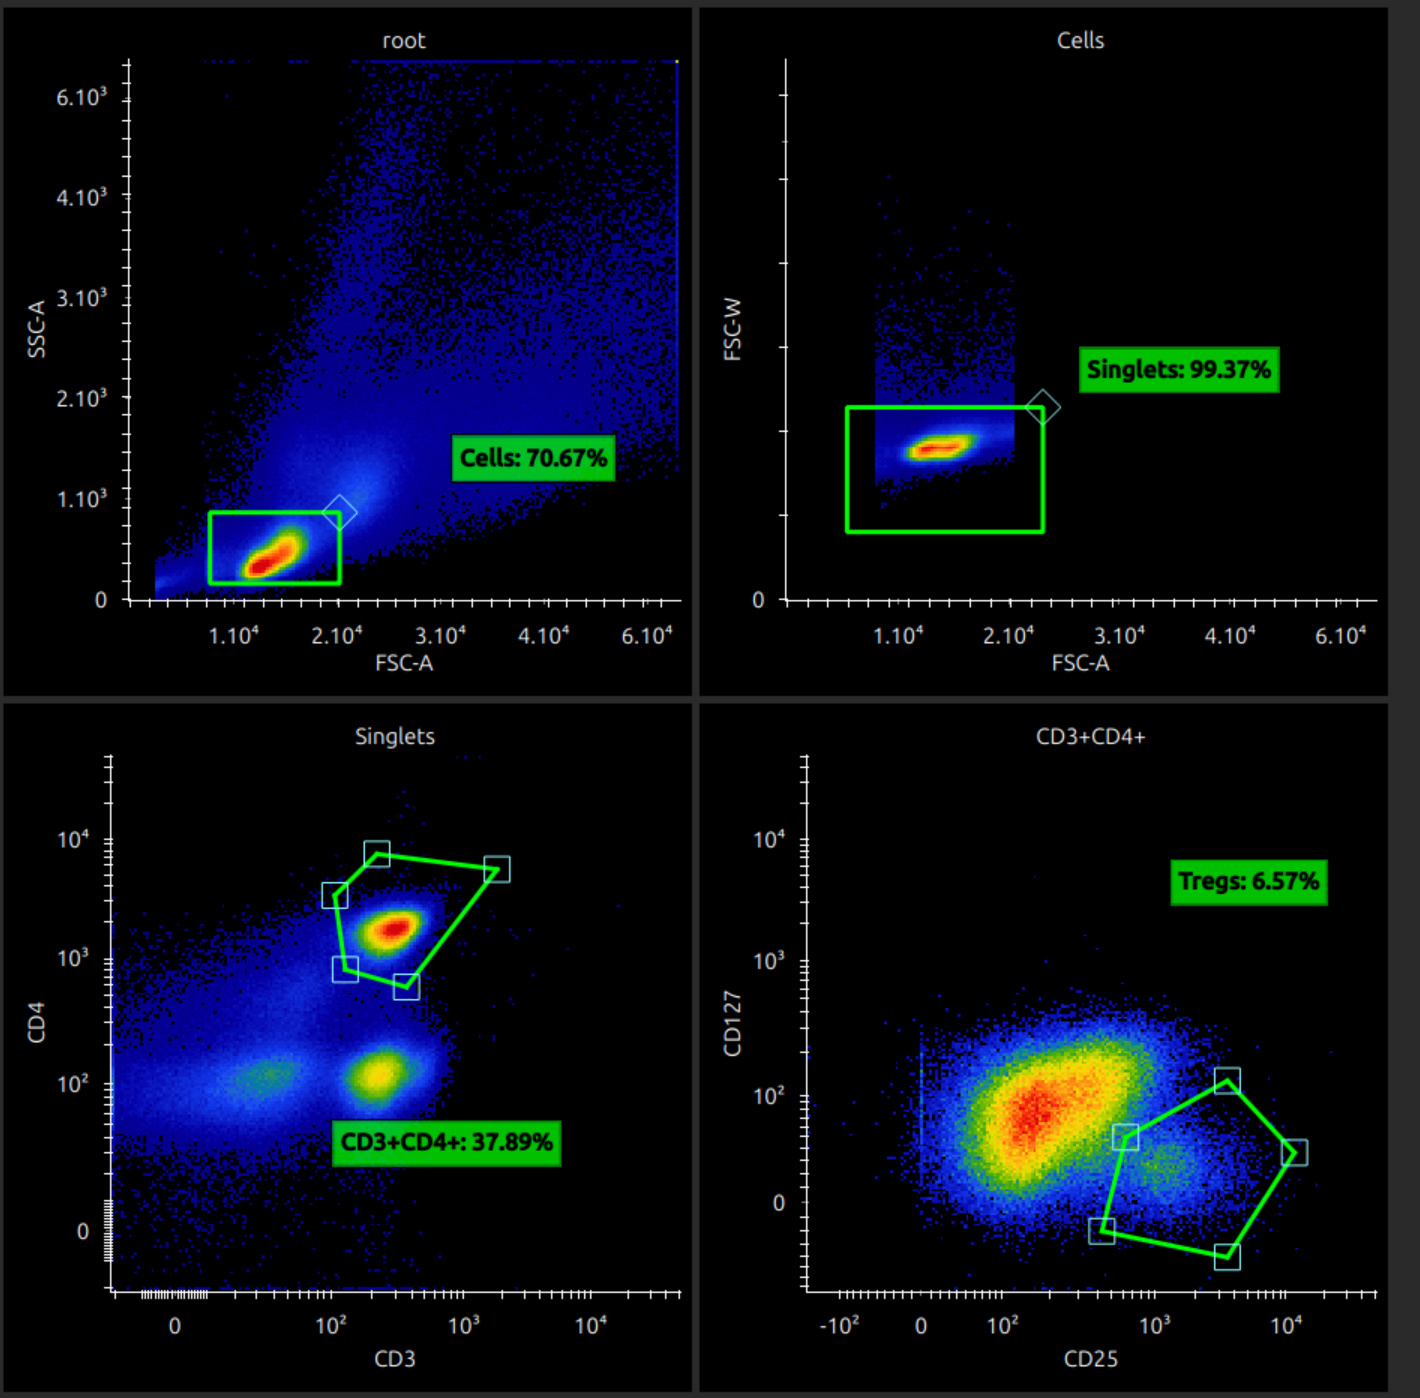
Analyse unmixed cytometry
You can now analyse your unmixed data. Manipulating plots and gates should hopefully be intuitive, but here are some instructions.