
Reports and exports
Write a report for a sample, copy or export plots, and export unmixed FCS files.
From your unmixed data, Honeychrome can:
- write a sample report as a Word (DOCX) file;
- copy or export any plot as an image;
- export unmixed FCS files for a folder of samples.
To compare samples with charts, see Simple Stats.
Sample report
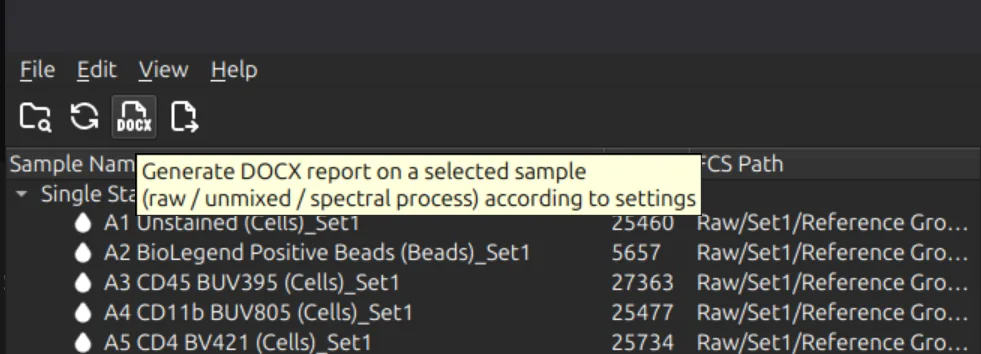
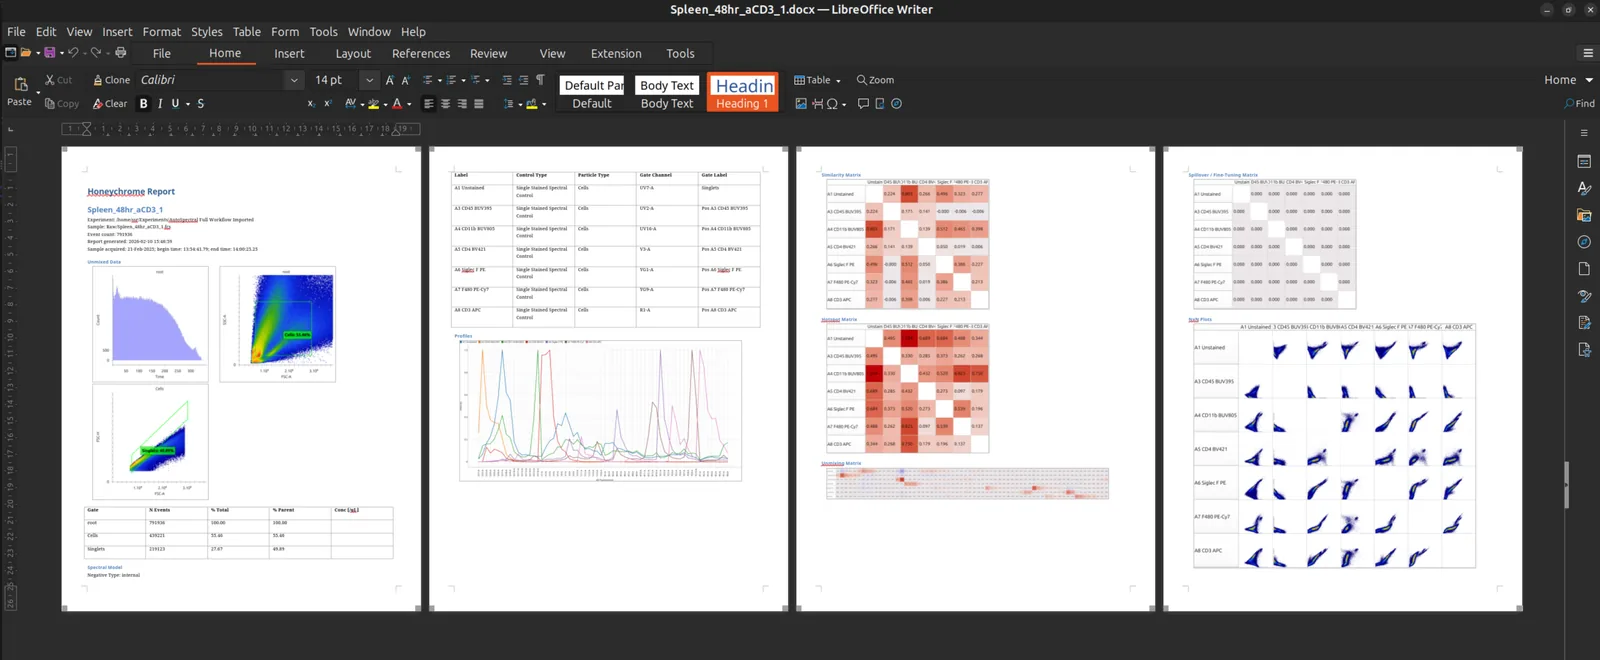
Select a sample in the sample browser and click the DOCX button on the toolbar, or choose File > Generate Sample Report.
- The report can include the raw data, the spectral process and the unmixed data for that sample. By default it has the unmixed data and the spectral process; choose what to include in Edit > App Configuration.
- It is saved in the experiment’s
Reportsfolder, in subfolders that mirror theRawfolder. - Figures and tables can be copied from the report into other documents.
Copy or export a plot
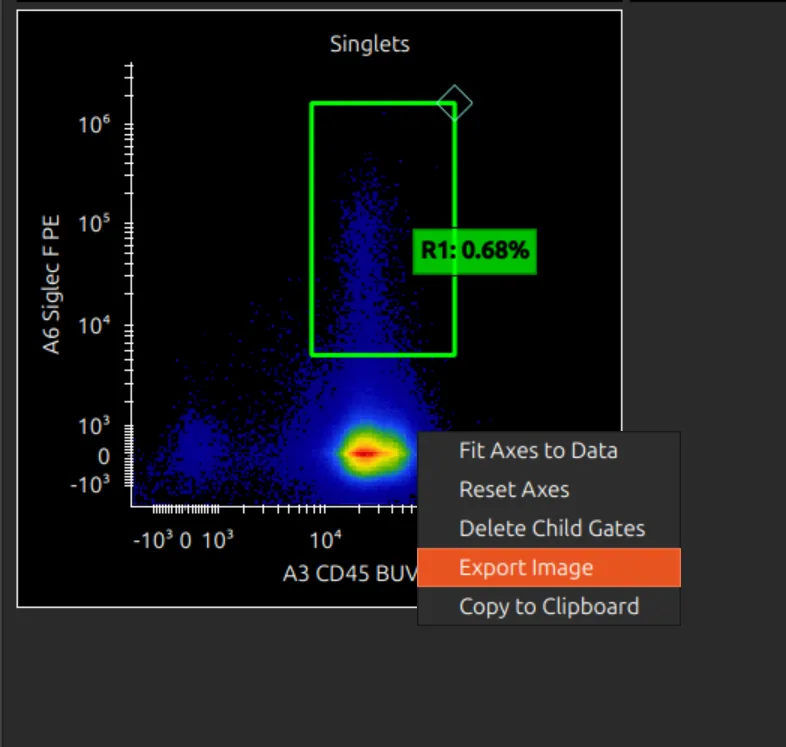
Right-click a plot to copy it to the clipboard or export it as a PNG file.
Export unmixed FCS files
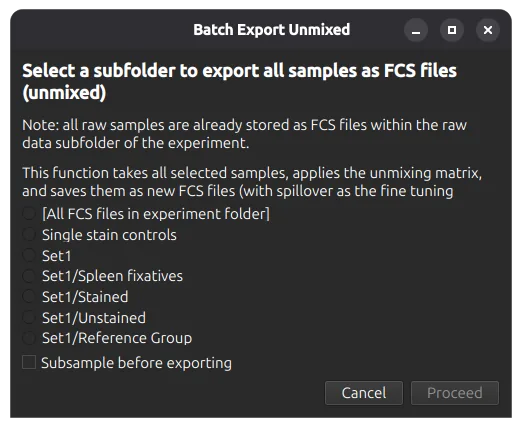
Choose File > Batch Export FCS Files, or use the toolbar button.
- Choose the folder of samples to export.
- Optionally tick Subsample before exporting. The number of events kept is set in Edit > App Configuration (10,000 by default).
- Click Proceed.
Each sample is unmixed and written as a new FCS file in the experiment’s Unmixed folder, in the same subfolders as the raw data.
- Samples are unmixed with the experiment’s method: per-cell autofluorescence, the noise model or the spectral variants, with spectral corrections if you use them (see AutoSpectral in Honeychrome).
- The spillover written to the files is your fine-tuning matrix.
- Large files are exported in chunks to limit memory use. Exports with spectral variants start with a time estimate.
Your raw FCS files are never changed; they stay in the Raw folder.
An export is a long job, so other long calculations wait until it has finished; see Long jobs.