
Noise model
Weight each detector by how noisy it is, and pull fluorophores a cell clearly lacks towards zero, for narrower negatives in crowded parts of the panel.
Every detector reads with noise: a constant electronic floor plus photon noise that grows with the signal. Ordinary least squares trusts every detector equally, so the noisy detectors spread into channels that share them. The Noise page fits a model of each detector’s noise to your controls, and unmixes with it:
- Noise weighting lets the quiet detectors count for more and the noisy ones for less (generalised least squares).
- A positivity prior pulls each fluorophore towards zero in proportion to how likely the cell is to be negative for it, so its spread no longer lands in the other channels. Each channel is reported with its own prior removed, so a dim positive keeps its scale.
The noise model is new in Honeychrome 1.0. It is not covered in the AutoSpectral manuscript (Burton et al. 2025).
The noise model starts from per-cell autofluorescence, so assign AF profiles first (Autofluorescence). It is an alternative to the spectral variants; you can use one or the other.
Fit and use the model
- Choose the Unstained cells and the Bead negative. Both default to Auto:
- Unstained cells: the unstained cell sample with an AF profile and the lowest mean signal.
- Bead negative: the unstained bead samples, or the bead controls’ negatives.
The model also uses the single-stained controls of the Spectral Process.
- Press Model Noise. Each control is split: the model is fitted on 70% of its events and checked on the other 30%.
- Read the summary. It says how well the model predicts the held-out events. Tick Show calibration and detector tables for the details.
- Use the noise model for the experiment’s unmixing is ticked when the fit has finished. Untick it to go back to per-cell AF.
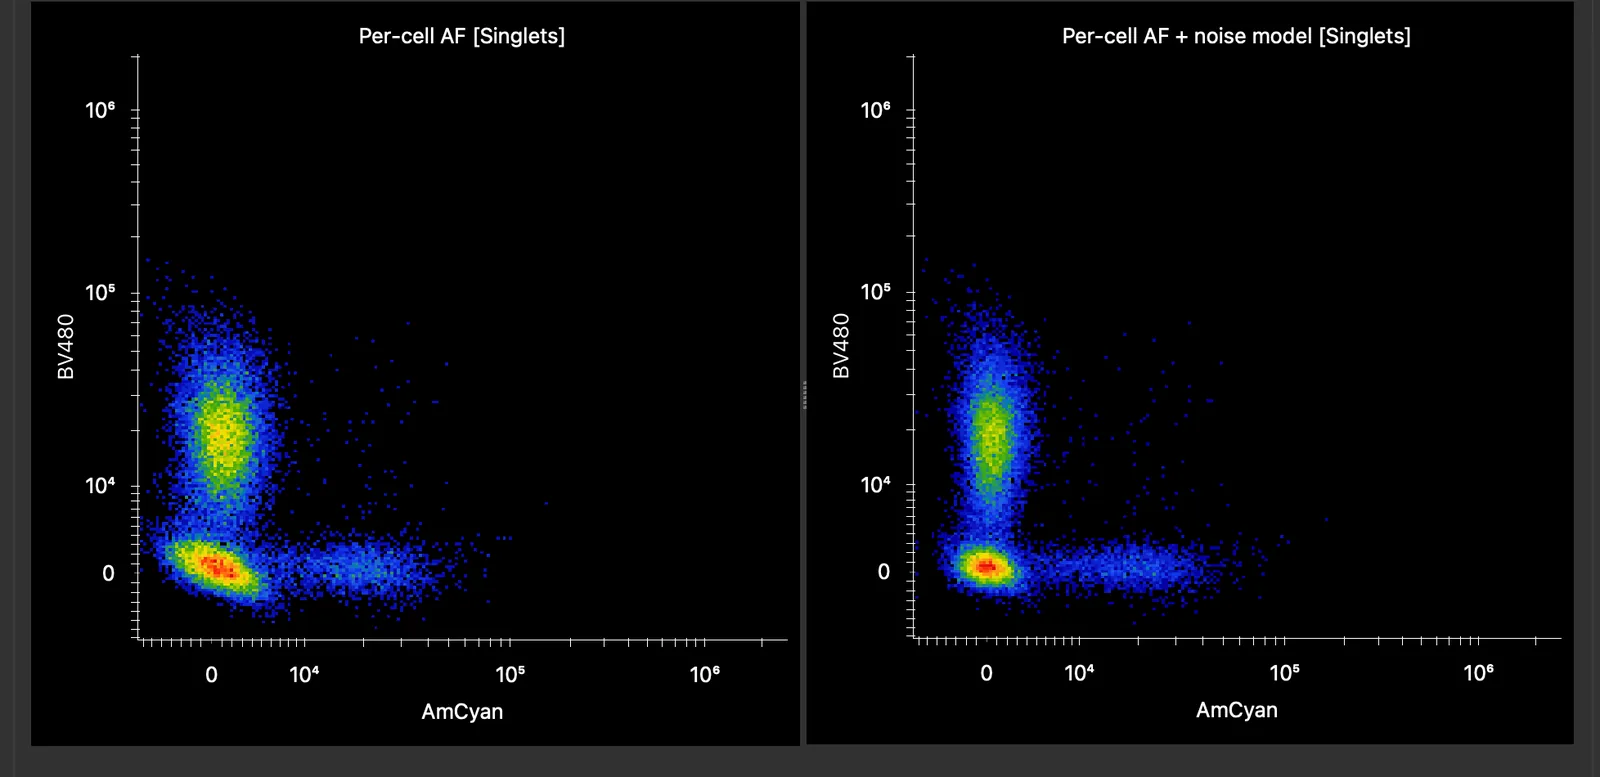
What good looks like: the model predicts the held-out variance to within 0.8–1.25 for at least 80% of the control cells, and in the comparison the negatives of neighbouring dyes are narrower with the noise model, while the positives stay where they were.
The positivity prior
Positivity prior (lambda) sets how strongly likely-negative fluorophores are pulled to zero; the default is 1. Higher values narrow the negatives further, at the cost of over-estimating dim cells that are positive for two near-identical dyes. Across four large panels:
| λ | Negatives, against the AutoSpectral optimisation | Bias on dim double positives of near-identical dyes |
|---|---|---|
| 0.5 | about 20% narrower | about +9% |
| 1 (default) | about 28% narrower | about +14% |
Changing λ unmixes the displayed sample again.
Events the model uses
The noise model chooses its own events and does not use your gates:
- each sample is read in full;
- the densest population on FSC-A × SSC-A is found, and the 95% ellipse around it is kept (saturated scatter events included, as bright beads saturate scatter on some cytometers);
- then the singlets on FSC-A against FSC-H are kept.
Doublets and bead aggregates would otherwise read as extra noise at high signal. The tables give the number of events selected from each sample.
Data clamped at zero
Some cytometers write values clamped at zero, with no negative values on any detector; this has been seen on the Attune Xenith and Bigfoot. Their noise is cut off at zero, which the noise model does not describe. When neither the unstained cells nor the bead negatives have a detector with 1% of values at or below zero, Model Noise leaves the noise model off. It then unmixes with Poisson weights (with a floor of 10 photoelectrons) and the positivity prior instead. You can still tick the noise model.
Speed and the unmixing cache
Unmixing with the noise model takes longer than per-cell AF. When you open a sample, the Unmixed Data tab shows per-cell AF at once and swaps in the noise-model result when it is ready; the status bar says so.
Results are kept in the experiment’s cache/unmixed folder, so a sample you open again appears at once. Unmixing cache size in App Configuration sets how much space the cache may take (default 8 GB per experiment); the least recently used files are removed first.
While another long job runs, Model Noise, the Use tick box and λ are greyed out; see Long jobs.
Credit and further reading
The noise model and noise-weighted unmixing were shaped by the work of, and discussions with, Paul Heisig (Amsterdam UMC) and David Novo.
- Novo D, Grégori G, Rajwa B. Generalized unmixing model for multispectral flow cytometry utilizing nonsquare compensation matrices. Cytometry A 2013;83(5):508–520. doi:10.1002/cyto.a.22272
- Novo D. A comparison of spectral unmixing to conventional compensation for the calculation of fluorochrome abundances from flow cytometric data. Cytometry A 2022;101(11):885–891. doi:10.1002/cyto.a.24669
- Kmet R, Novo D. Reducing spreading: removing the impact of irrelevant dyes improves unmixed flow cytometry data. Cytometry A 2025. doi:10.1002/cyto.a.24957
- Nguyen R, Perfetto S, Mahnke YD, Chattopadhyay P, Roederer M. Quantifying spillover spreading for comparing instrument performance and aiding in multicolor panel design. Cytometry A 2013;83(3):306–315. doi:10.1002/cyto.a.22251
- Konecny AJ, Mage PL, Tyznik AJ, Prlic M, Mair F. OMIP-102: 50-color phenotyping of the human immune system with in-depth assessment of T cells and dendritic cells. Cytometry A 2024;105(6):430–436. doi:10.1002/cyto.a.24841. The example data on this page; the OMIP-102 data were kindly provided by Florian Mair.