Conventional compensation
Use Honeychrome for conventional cytometry, with single-stained controls, manual compensation, or no compensation at all.
Honeychrome was built for spectral cytometry, but it works just as well for conventional cytometry: conventional cytometry is a kind of spectral cytometry with one detector per fluorophore. You can use single-stained controls, compensate by hand, or ignore compensation.
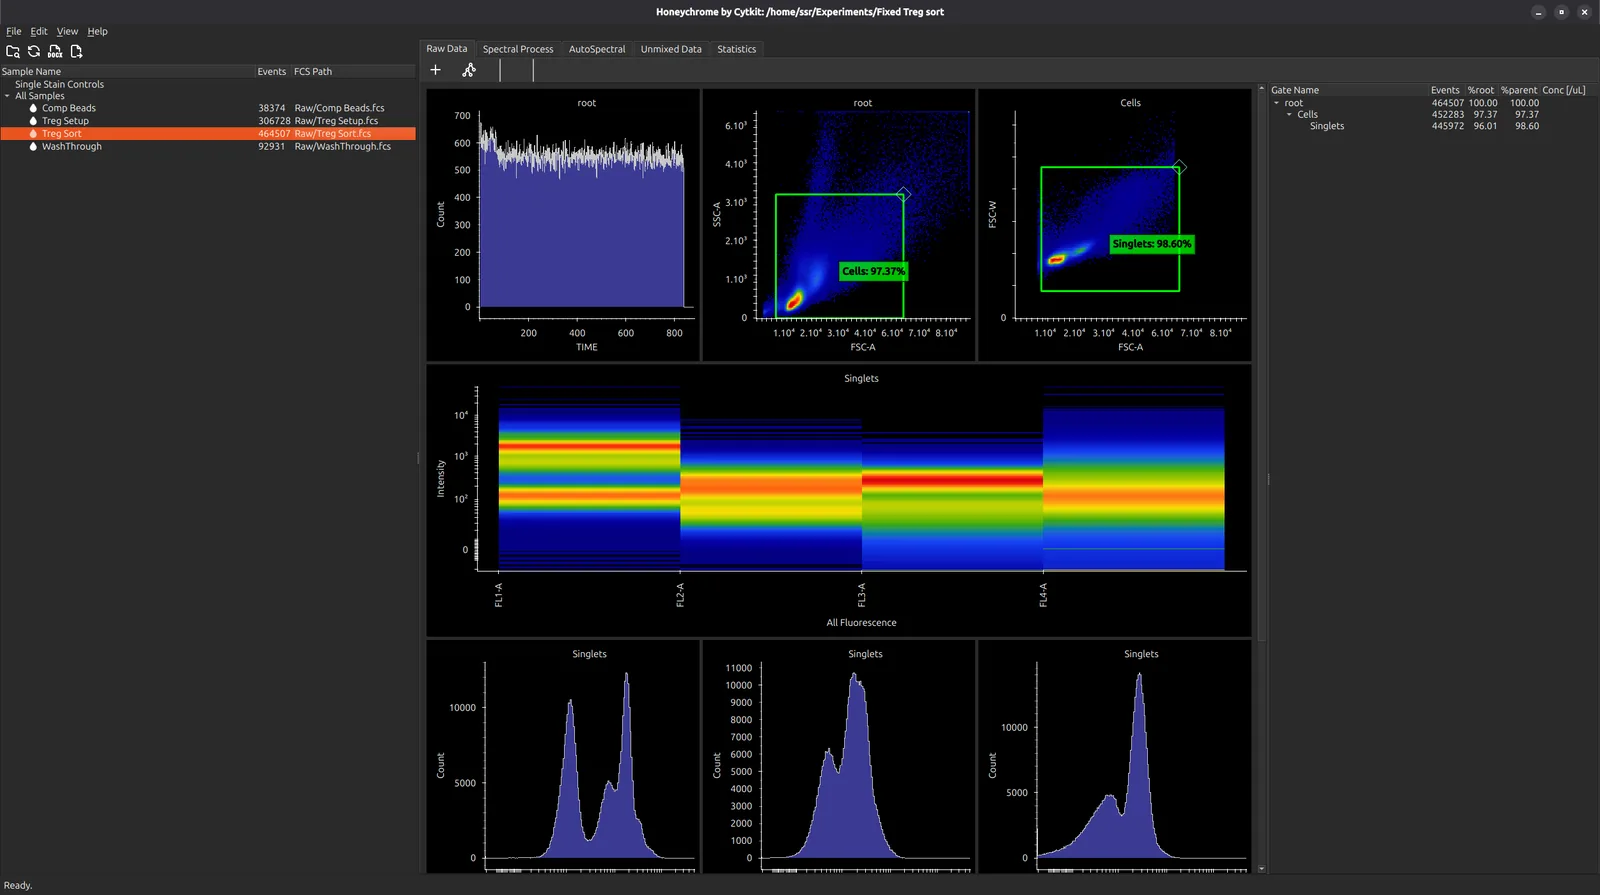
Do not analyse your data in the Raw Data tab. The Raw Data tab shows the instrument’s detectors; your markers appear in the Unmixed Data tab. The Spectral Process tab defines how the detectors map to your labels.
You can define that mapping in two ways:
- with single-stained controls, exactly as in Spectral unmixing;
- or by assigning each label to a detector in the spectral model editor, as below.
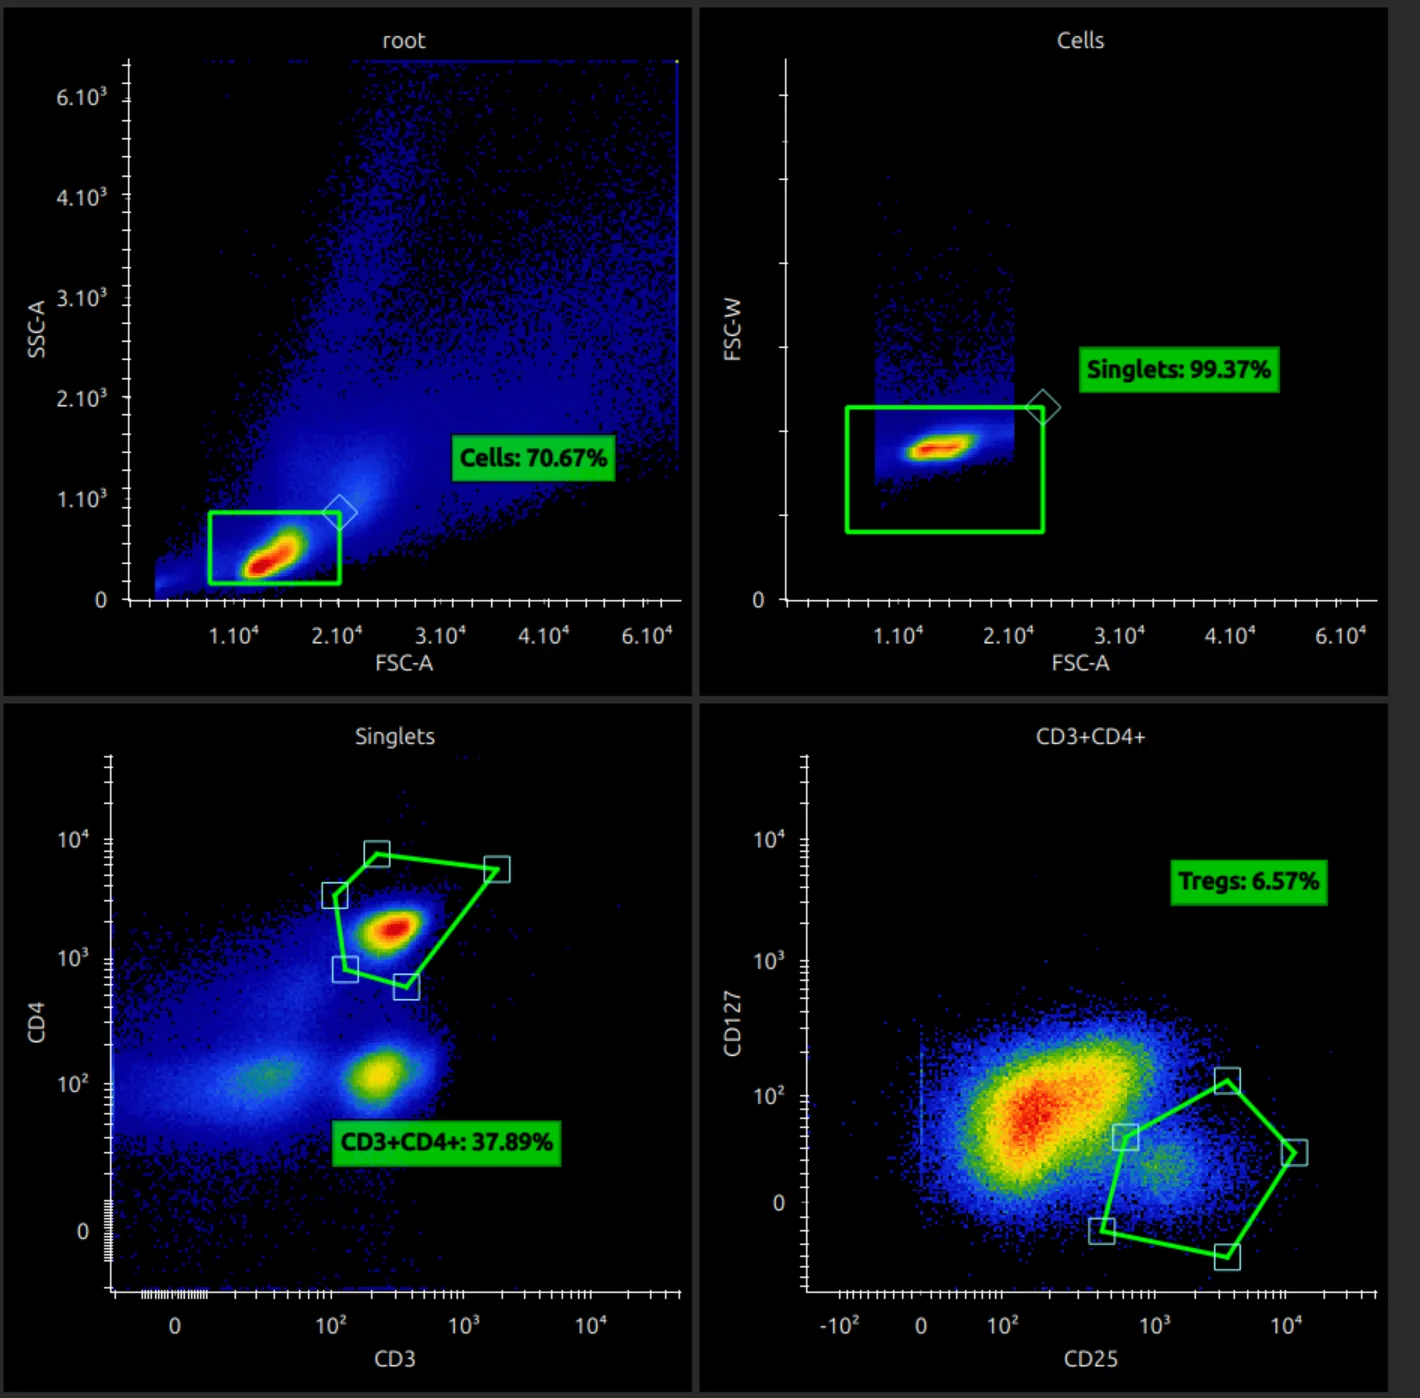
This example uses a few Treg samples with no single-stained controls, and compensates by hand.
Import your data
Choose File > Import FCS Files. The Raw Data tab shows every instrument channel.
Assign labels to detectors
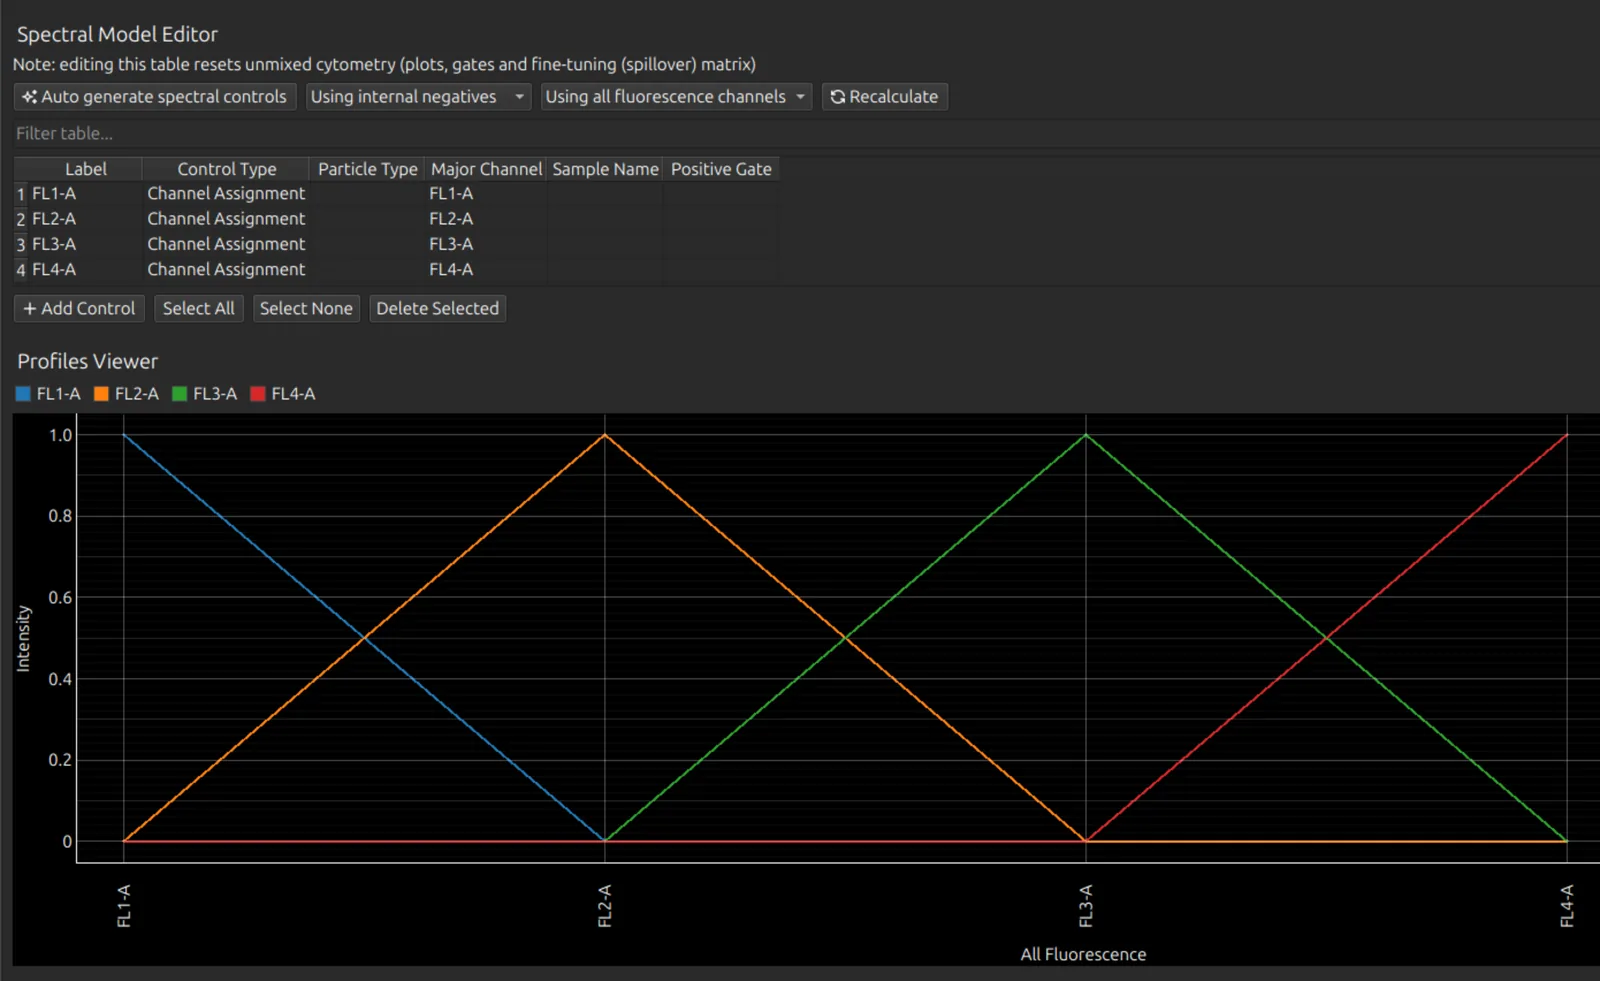
In the Spectral Process tab, in the spectral model editor, either:
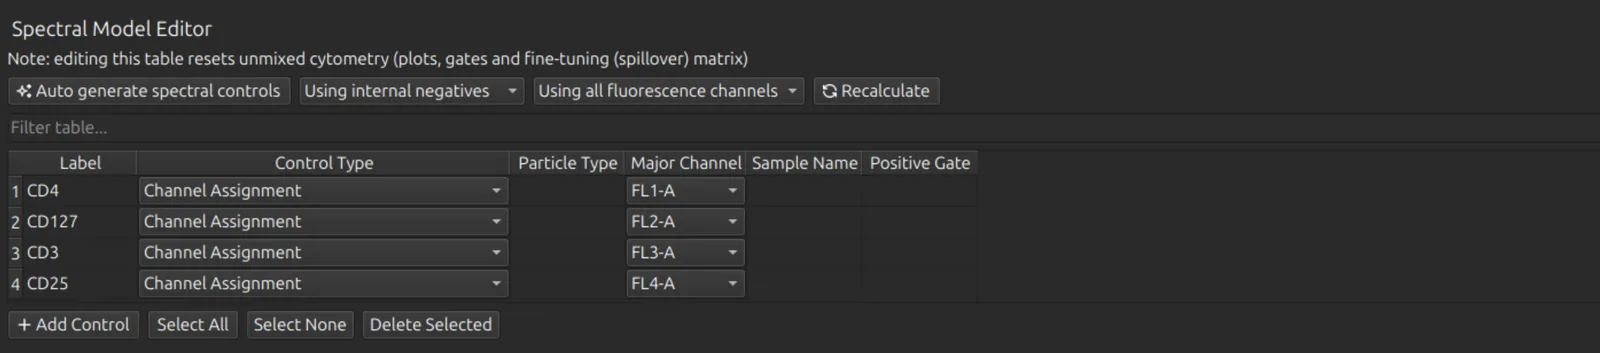
- add one row per label: type the label, choose Channel Assignment as the Control Type, and choose the detector;
- or press Auto generate spectral controls to add them all at once.
A channel assignment is the same as a spectrum with intensity 1 in its detector and 0 everywhere else, as the profiles viewer shows.
Then rename the labels. Here they are CD4 (FL1, the FITC detector), CD127 (FL2, PE), CD3 (FL3, PerCP) and CD25 (FL4, APC).
Compensate by hand
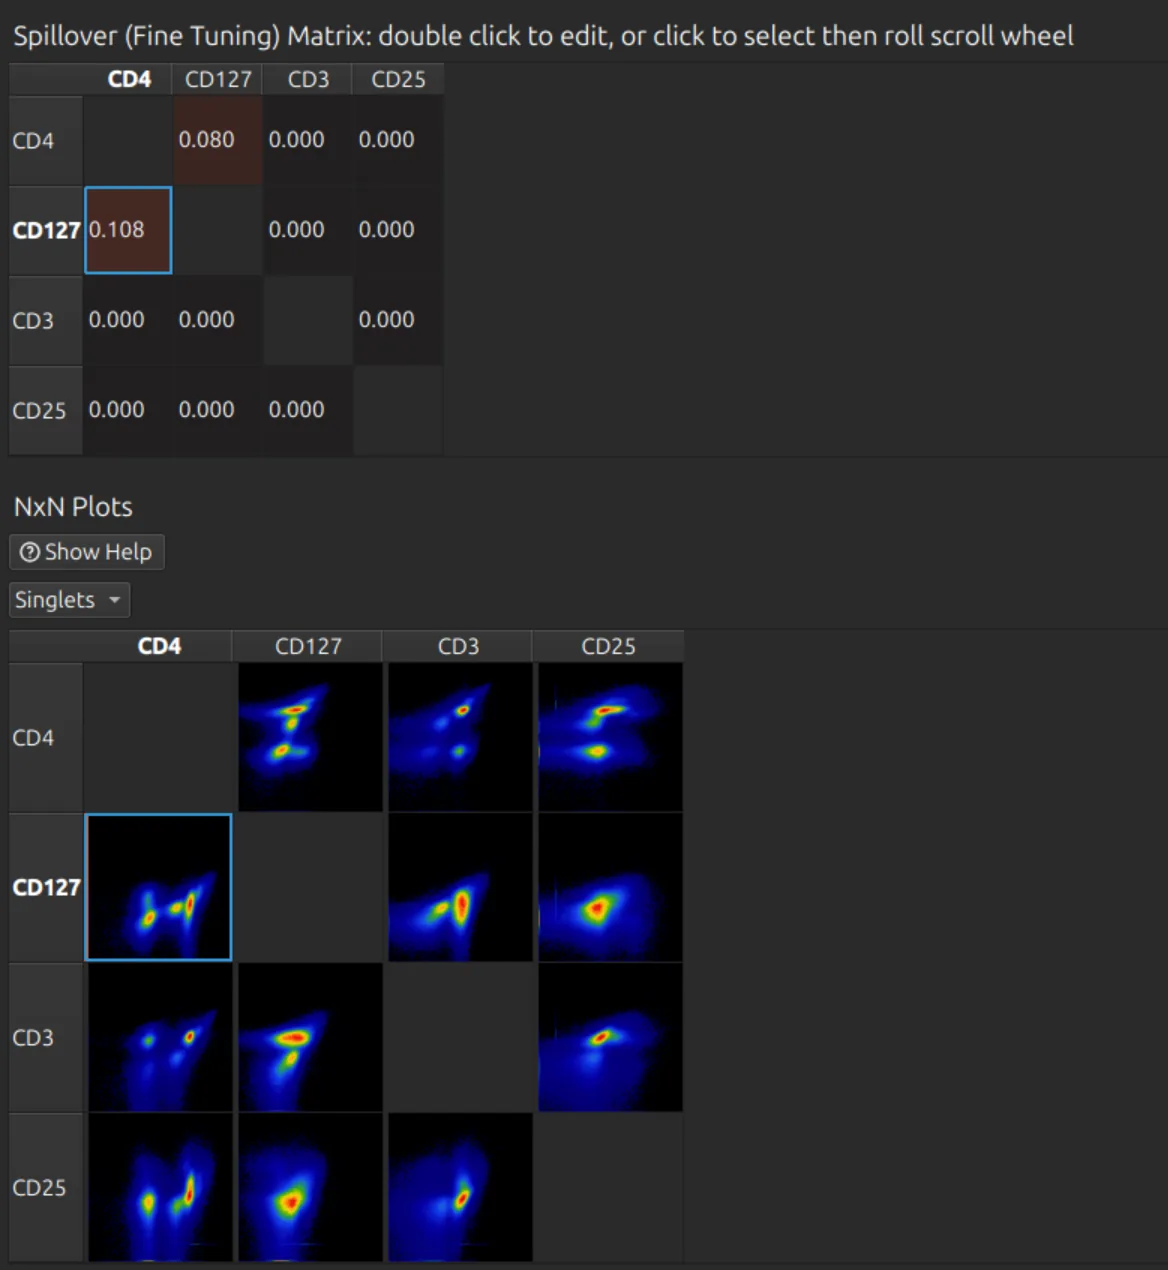
Scroll down to the spillover matrix and the NxN plots. Here a few percent of compensation is needed between FITC and PE, in both directions. Click a cell to select it, then roll the mouse wheel to adjust it, or double-click the cell to type a value. Repeat for any other pairs.
Analyse the compensated data
Open the Unmixed Data tab; see Plots and gates.