
Spectral correction
Find and fix the small spectral errors that show up only in fully stained samples, such as tandem breakdown that differs from your controls. Beta.
Single-stained controls give each fluorophore’s spectrum, but a reference spectrum can still be slightly wrong for your fully stained cells: a tandem dye that has degraded differently, a control stained on beads, a different buffer. This shows as residual spillover: cells negative for a marker read above or below zero in proportion to another marker. In a fully stained sample a marker-negative population must read zero. Fix My Unmix measures the spillover there and corrects the spectra.
Spectral correction is in beta testing. It has been tested on many datasets but may still need tuning. Always check the result in the comparison and the results table, and untick any correction you do not believe.
Spectral correction is new in Honeychrome 1.0. It is not covered in the AutoSpectral manuscript (Burton et al. 2025).
Run Fix Unmix
- Setup lists what the other pages provide:
- the AF profiles (every sample is unmixed with its own);
- the spillover spread (it widens the positivity boundaries);
- the spectral variants (a prior on how large a correction can plausibly be);
- the experiment’s unmixing method, which the corrected spectra feed.
- Samples. By default every sample that is not a bead sample, an unstained sample or a single-stain control is used, run together. Default Samples restores this; the Include tick boxes offer the other types too. Tick Concatenate per group to correct each raw subfolder on its own; each sample is then unmixed with its own group’s spectra.
- Unstained sample. Each group needs one for its positivity thresholds. Auto picks the unstained cell sample whose scatter fits the group best; Match Unstained shows the choice. You can also choose one yourself.
- Gate and events. Set the gate and the number of events per group (400,000 by default). Events are drawn equally from the group’s samples. With fewer events the corrections are noisier: on 40–50 colour panels, half of a run’s corrections differed between two halves of 200,000 events.
- Optionally tick Fluorophores kept fixed. Their spectra stay as they are.
- Press Fix Unmix. Every run starts again from the base spectra.
Review the results
- The results table lists the fluorophores that changed, with the angle of each change and an Active tick. Untick Active to keep a fluorophore’s base spectrum.
- The before and after spectra, and a heatmap of the change (Show spectral change heatmap).
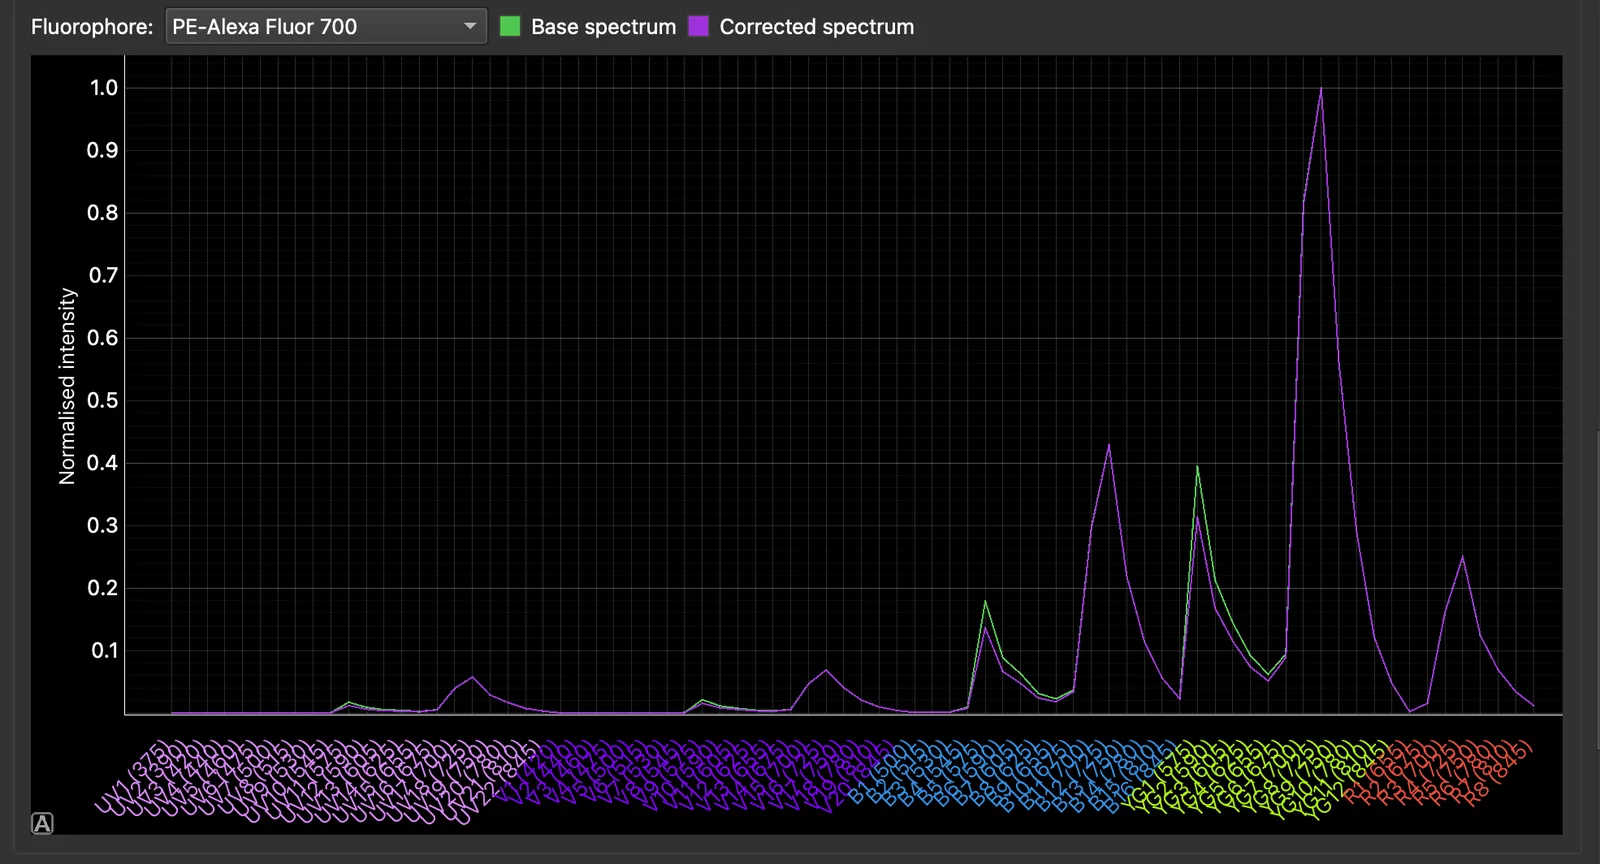
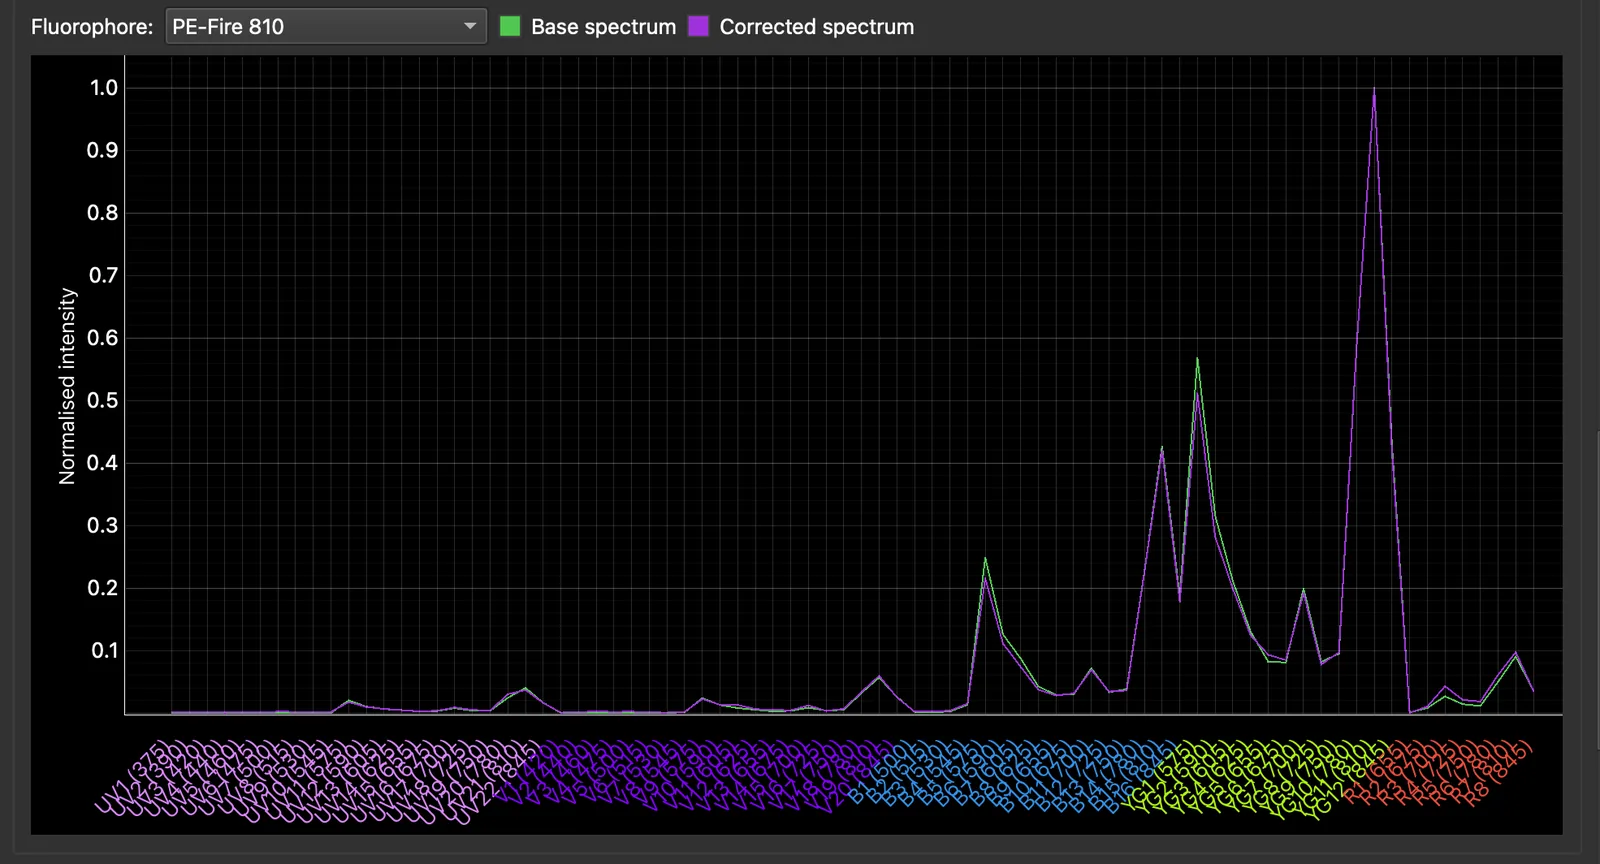
- A tandem whose change lies along its parent dye’s spectrum alone (PE-Cy7 along PE, say) was corrected through its parent fraction. This is what tandem breakdown in the sample looks like, or a reference with more breakdown than the sample.
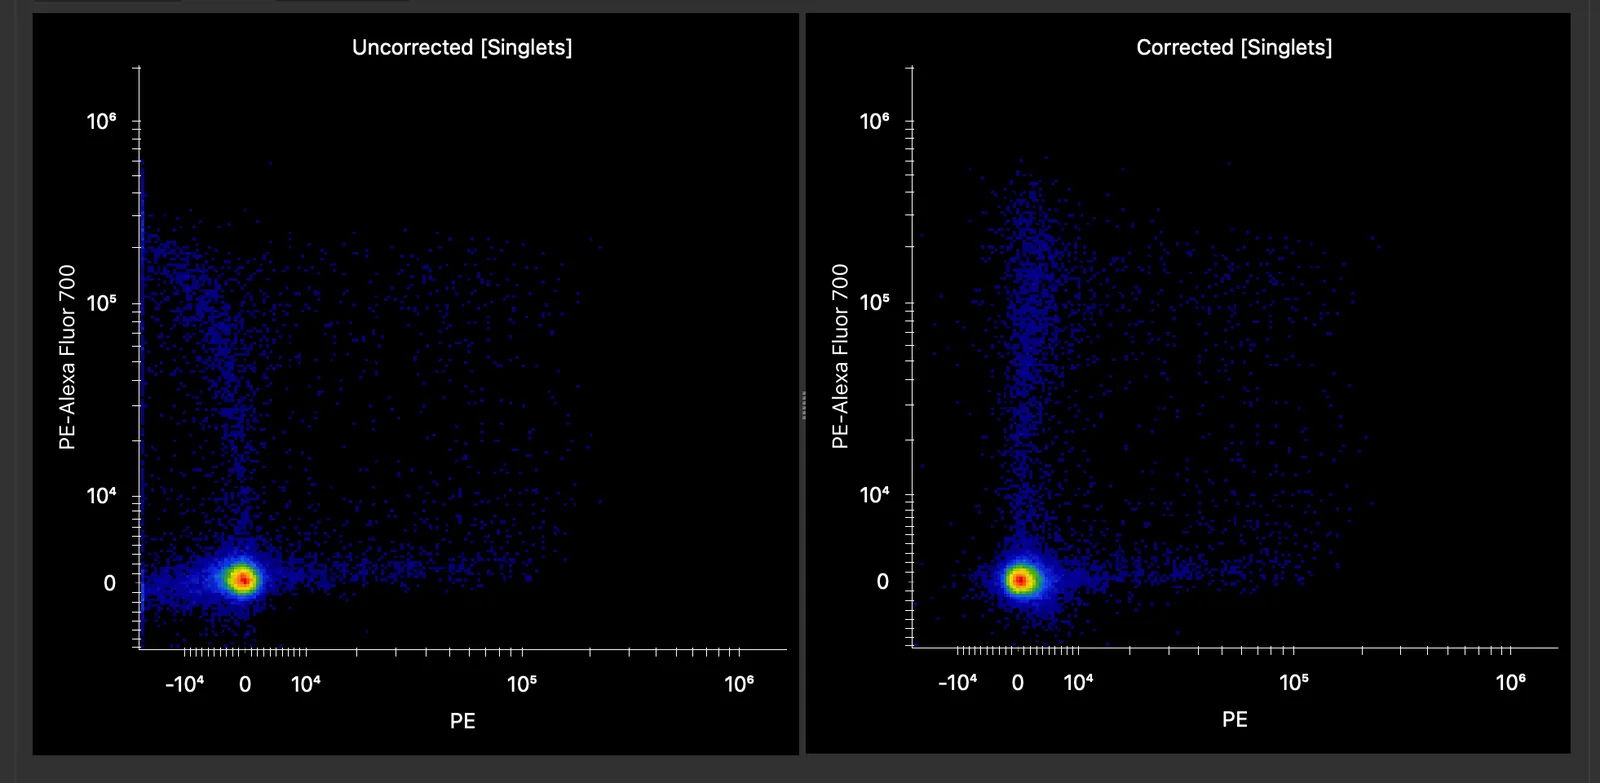
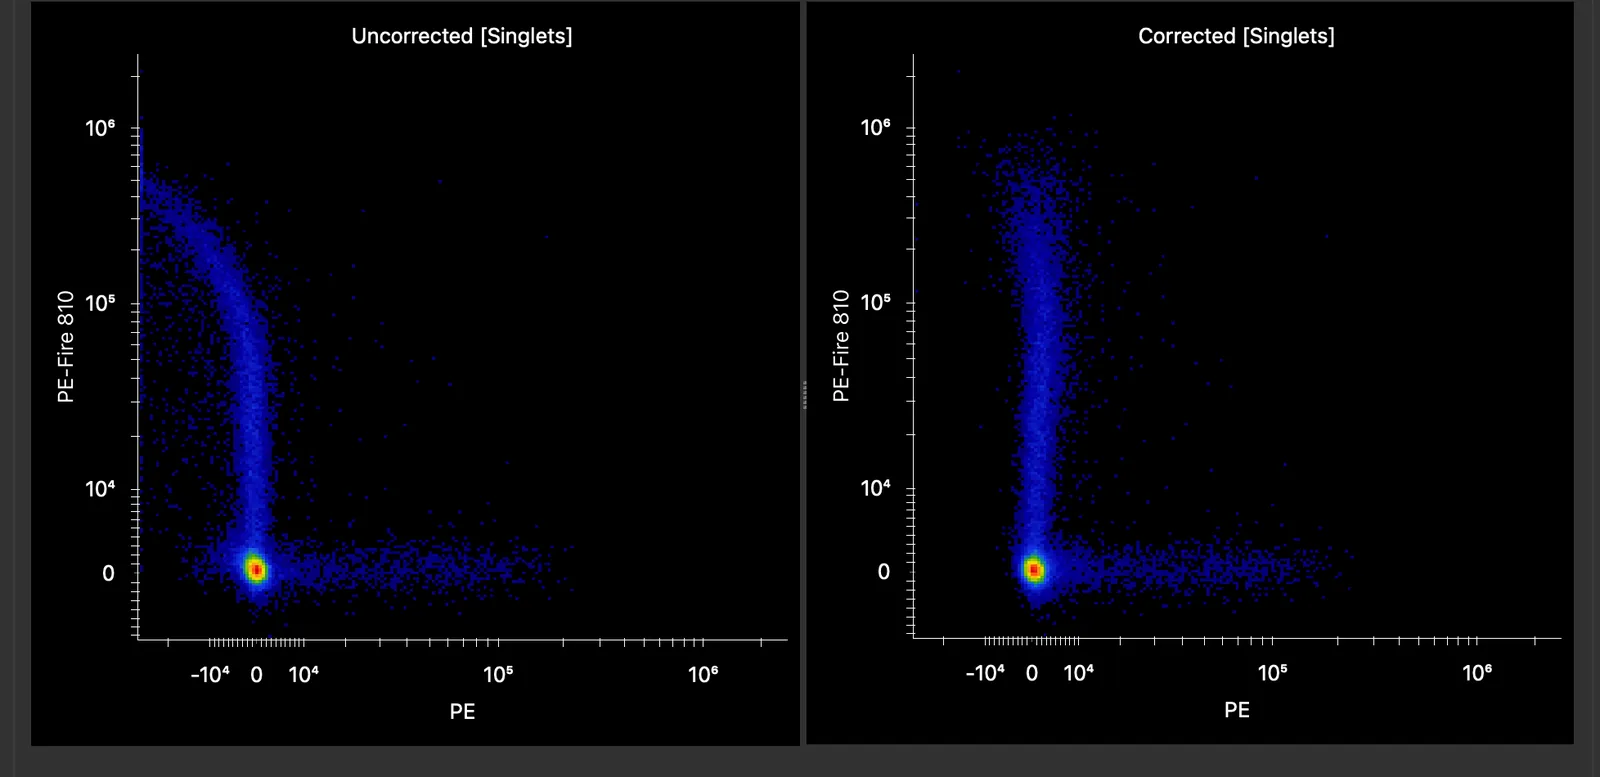
The spectra behind these two corrections are shown below. Both tandems changed mainly in the PE detectors on the blue and yellow-green lasers, that is, in their parent fraction.
The comparison shows the current sample, whichever it is, with the base spectra and with the corrected spectra, both by the experiment’s unmixing method. It uses the pair of channels that changes most. For a sample the experiment’s unmixing does not correct (a control, an unticked subfolder, or with the corrections unticked), the comparison is marked as a preview.
What good looks like: a negative population that drifted up or down with another marker now lies flat at zero, and each corrected spectrum differs from its base spectrum by a small angle (shown in the results table). Be suspicious of a large change, and of a correction that gives a dye signal in detectors where it had none.
Use the corrections
Use spectral corrections for the experiment’s unmixing is ticked after the run. Every fully stained sample (not an unstained, single-stain or bead sample) is then unmixed with the corrected spectra by the experiment’s method (per-cell AF, the noise model or the spectral variants), everywhere in the app.
- After a run per group, each sample takes its own raw subfolder’s corrections. A subfolder that Fix Unmix did not run on keeps the base spectra.
- Untick a raw subfolder under Apply the corrections to the samples of to keep its samples on the base spectra.
The corrections are an overlay: your control spectra in the Spectral Process are not changed. If those spectra change, for example because you clean the controls again, the corrections no longer apply. They are cleared with a message on the page; run Fix Unmix again.
How it works
Fix My Unmix comes from the AutoSpectral package’s fix.my.unmix(). It runs in two phases:
- Phase one measures, for every pair of fluorophores, the spillover from the clearly positive cells of one into the cells negative for the other, with a trust weight for each measurement.
- Phase two re-measures the spectrum of every fluorophore that phase one changed, from the cells that fluorophore dominates. It adopts the new spectrum only if it passes every check: fit, offset, angle, collinearity, conditioning and leakage into channels its own cells are negative for.
Two safeguards keep corrections believable:
- Plausible change: a detector may change by at most its starting value, or by 0.003 of the peak, whichever is greater. This stops a dye from picking up signal where it had none, as happens when another dye is expressed on the same cells.
- Smooth updates (Advanced Settings, on by default): five rounds, each on a fresh half of the events, with the spectra moved only part of the way each time, so the noise of one subsample is averaged rather than adopted. It takes about three times as long as a single pass. Set Smooth updates: keep to Only corrections the rounds agree on to keep a correction only when most rounds found it and agree on it. Fewer fluorophores then change, and what changes reproduces.
While another long job runs, Match Unstained, Fix Unmix, the Use tick box and the Active ticks are greyed out; see Long jobs.
Further reading
- Burton OT et al. bioRxiv 2025. doi:10.1101/2025.10.27.684855
- AutoSpectral package on GitHub
- Olsman R et al. CompensAID: an automated detection tool for reference errors. Cytometry A 2026;109(2):124–134. doi:10.1002/cyto.a.70016
- Konecny AJ, Mage PL, Tyznik AJ, Prlic M, Mair F. OMIP-102: 50-color phenotyping of the human immune system with in-depth assessment of T cells and dendritic cells. Cytometry A 2024;105(6):430–436. doi:10.1002/cyto.a.24841. The example data on this page; the OMIP-102 data were kindly provided by Florian Mair.