Simple Stats
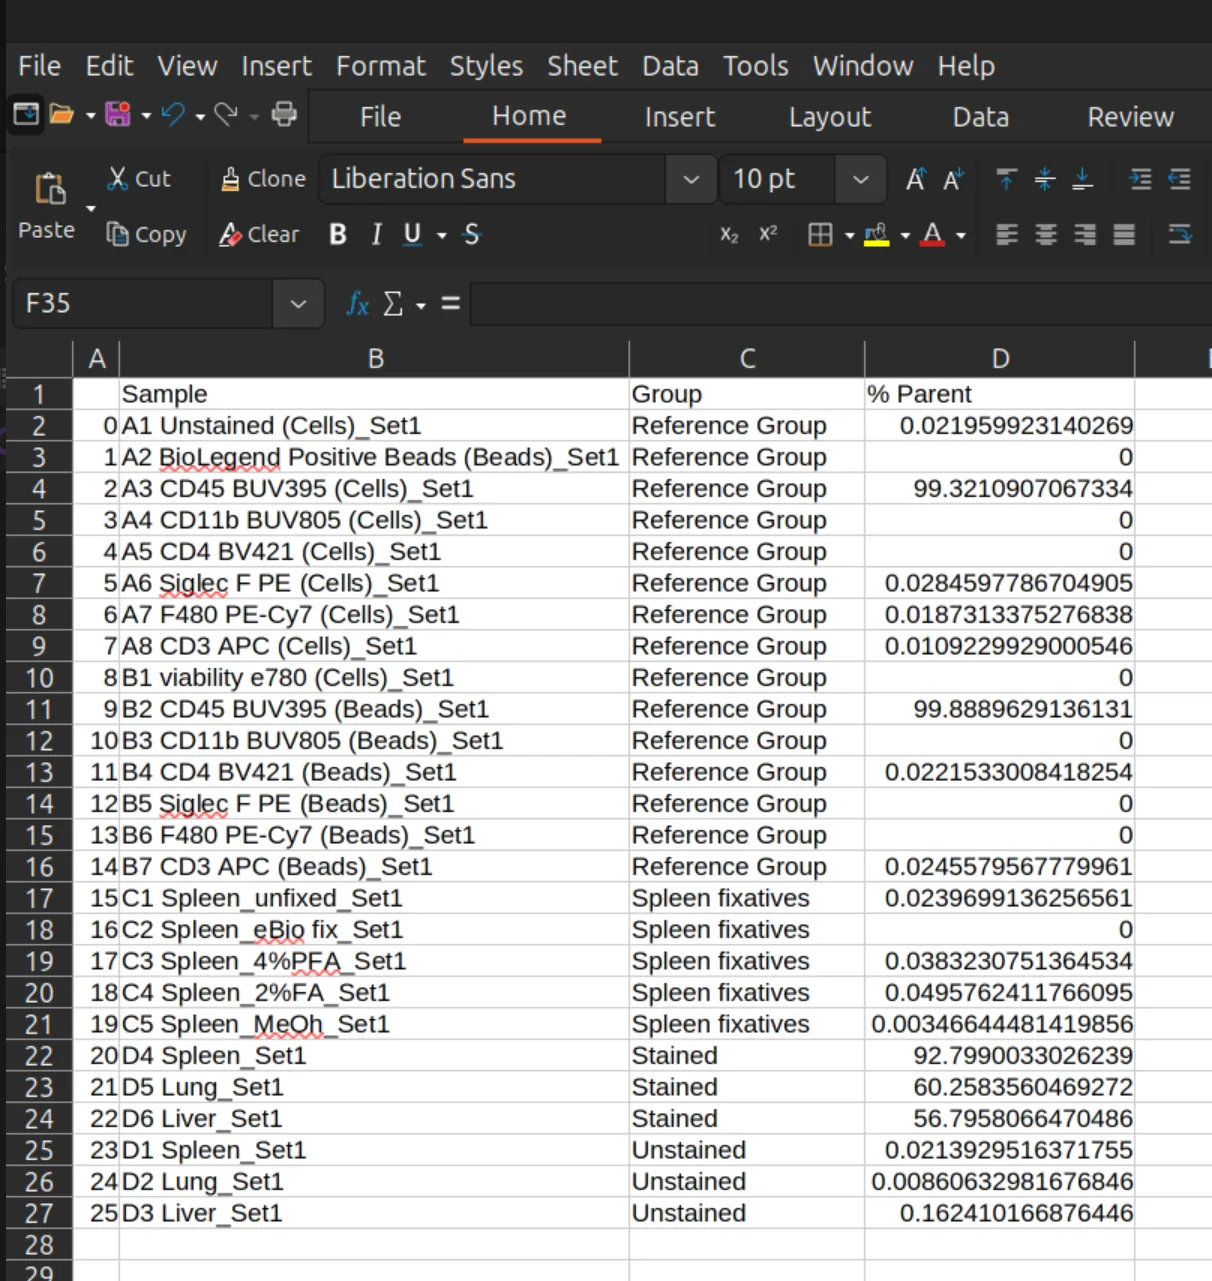
Compare samples or groups of samples with bar charts, box plots, histogram overlays and a sample by marker heatmap.
The Simple Stats tab (called Statistics before version 1.0) draws quick comparisons of a gate across samples. For high-dimensional analysis with clustering, differential testing and group statistics, enable the Honeycluster or Automated Gating plugin in Edit > App Configuration.
Make a chart
- Choose the samples. Pick a flat list of samples, or a set of folders. Folders are treated as groups.
- Choose the chart type: bar chart, box-and-whisker chart, 1D histogram overlay or heatmap.
- Choose the gate to compare.
- Choose the statistic (bar and box charts), or the channel (histogram overlay).

Bar chart and box-and-whisker chart
The statistics available are:
- % Total Events
- % Parent
- Number of Events
- Mean Intensity, in any channel
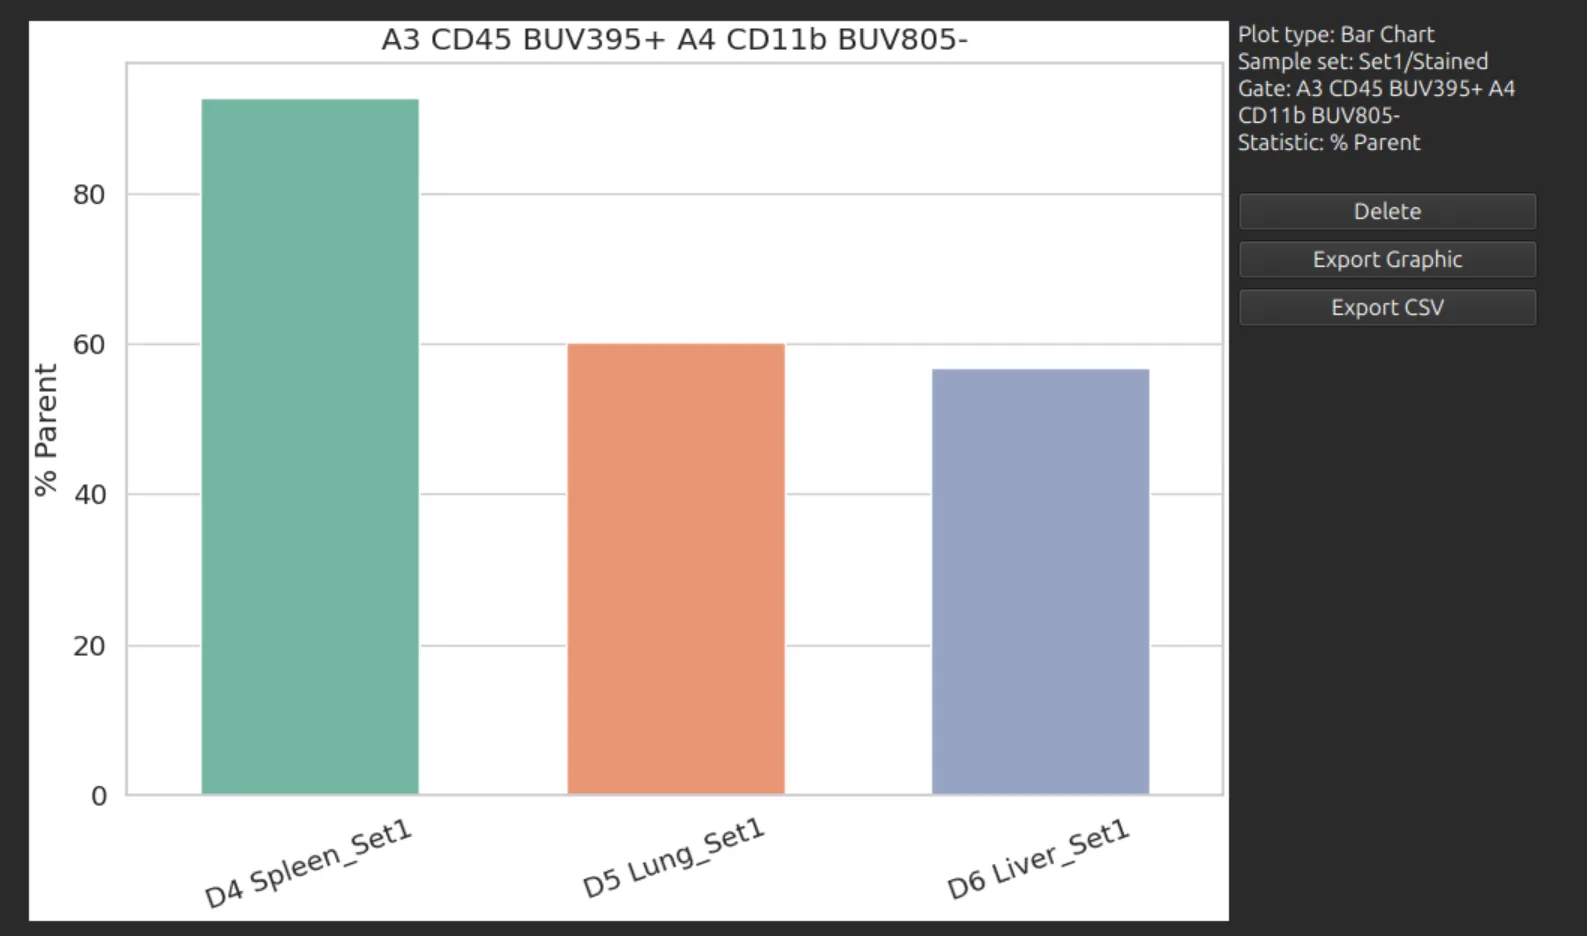
A bar chart shows one bar per sample.
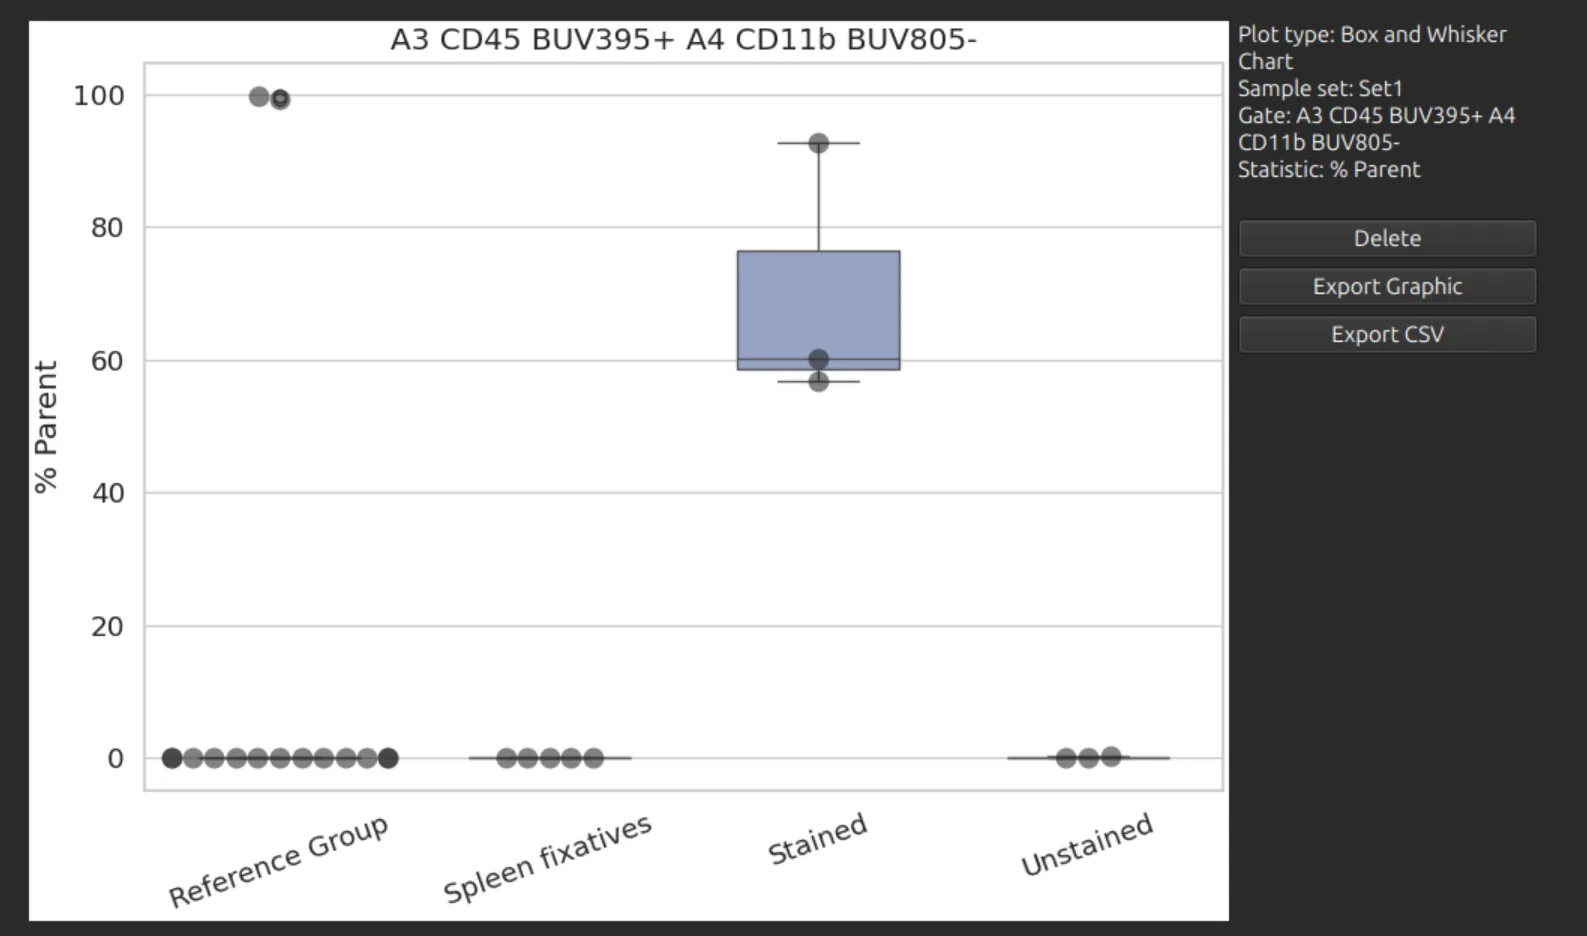
A box-and-whisker chart compares folders of samples: each folder is a group, and each sample in it a replicate.
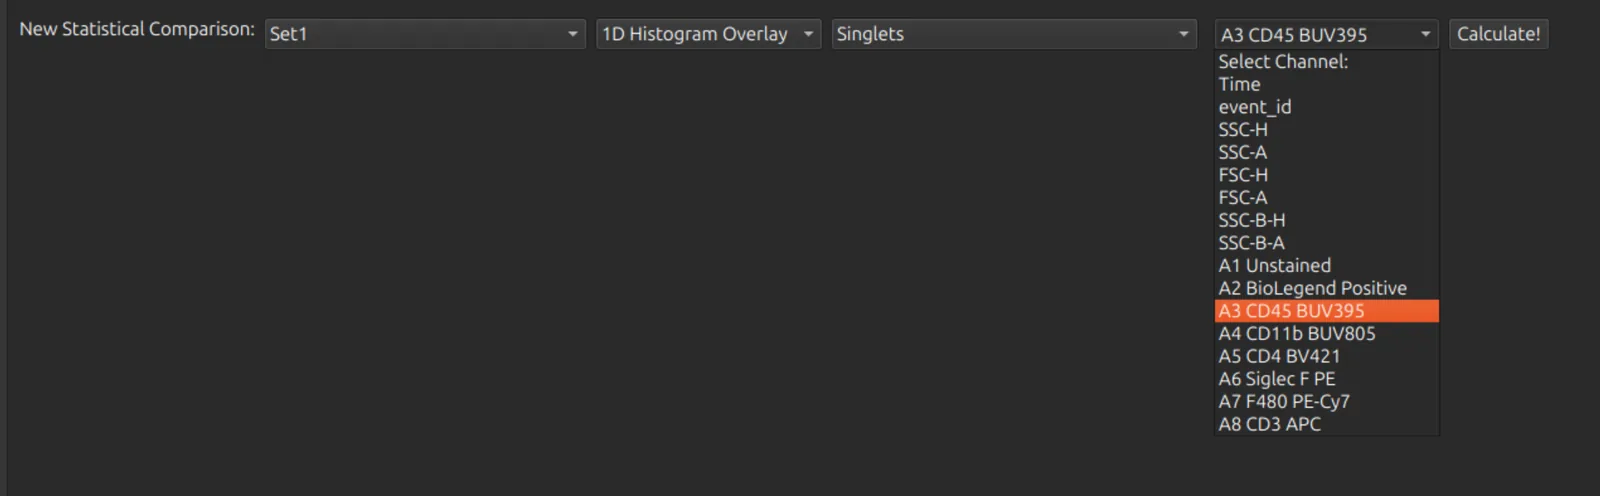
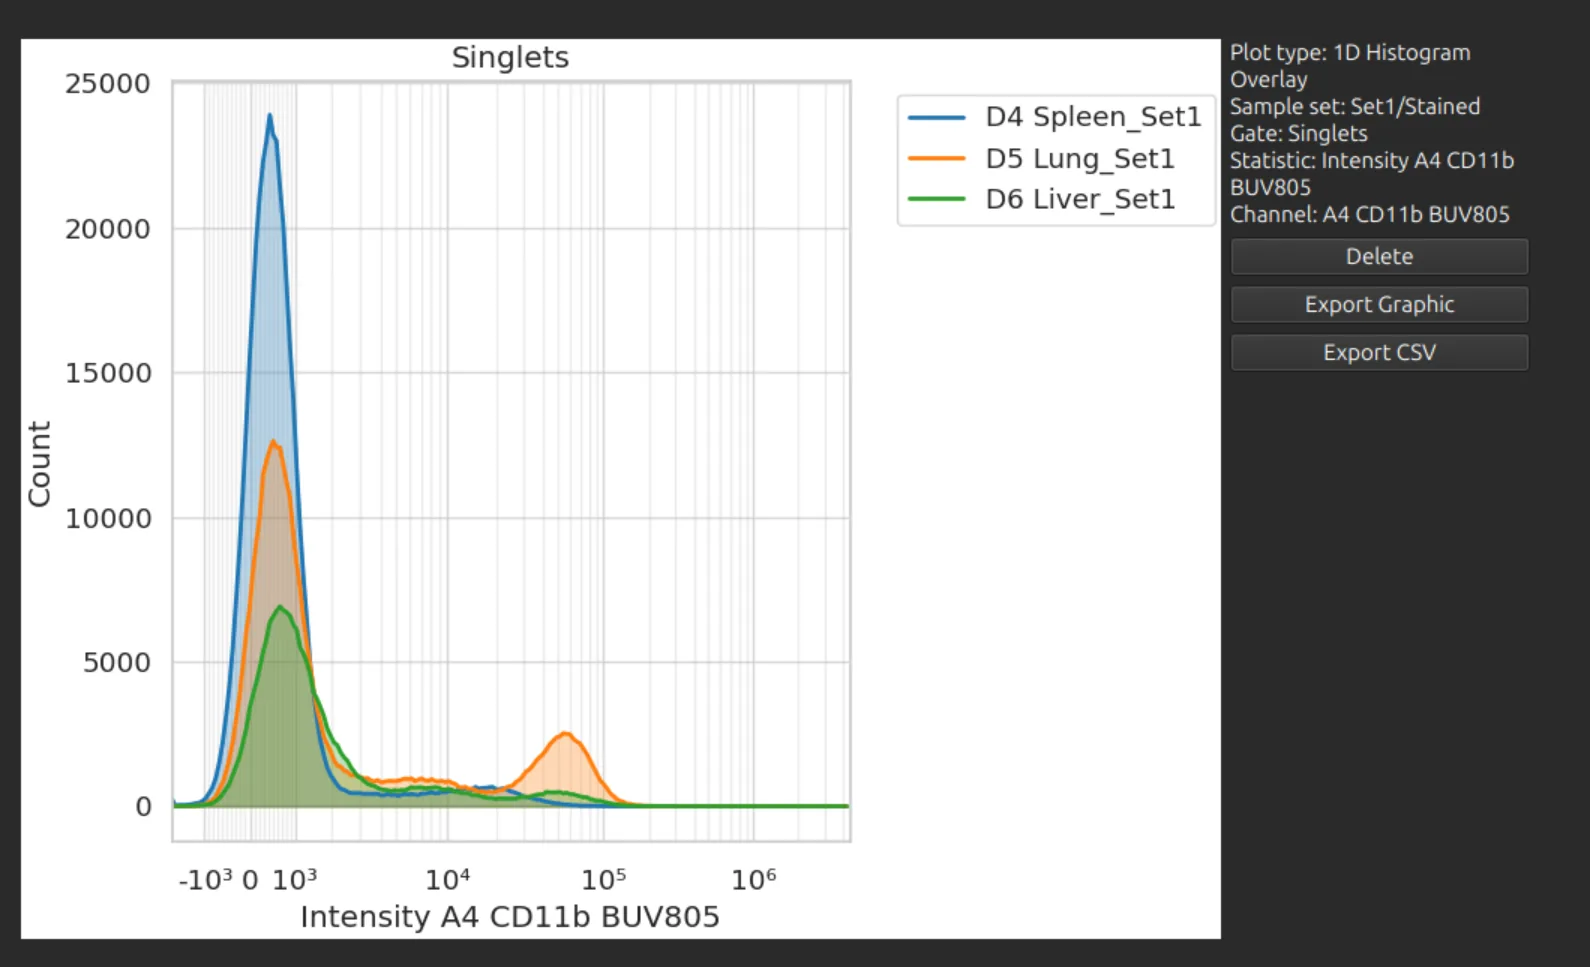
1D histogram overlay
Overlays the histograms of one channel for the chosen gate in each sample.
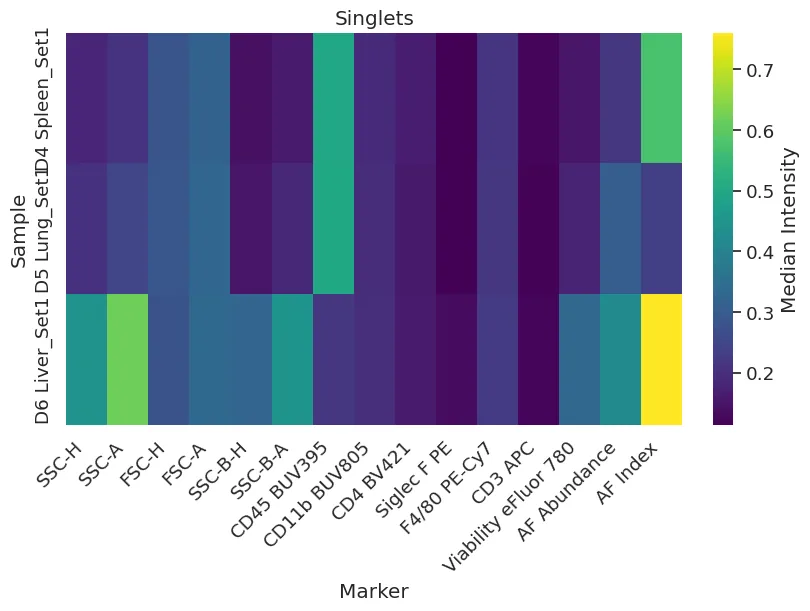
Heatmap
Shows the median intensity of every marker (columns) in the chosen gate for each sample (rows). There is no statistic or channel to choose.
Export the data
Charts can be exported as an image, or as a CSV file of their values to open in a spreadsheet.