
Plots and gates
Add and arrange plots, choose channels and transforms, and draw and edit gates.
This guide assumes you have unmixed data to look at, from Spectral unmixing or Conventional compensation. Plots and gates work the same way in the Raw Data and Unmixed Data tabs, but do your analysis in Unmixed Data.
Plots
Honeychrome draws three kinds of plot:
- 1D histograms;
- 2D histograms, which can also be shown as dot plots coloured by gate (see Display options);
- ribbon plots, which show the histograms of every channel side by side.
Click a plot to select it. The toolbar has + to add a plot, × to delete the selected one, and a button to show or hide the gating hierarchy.
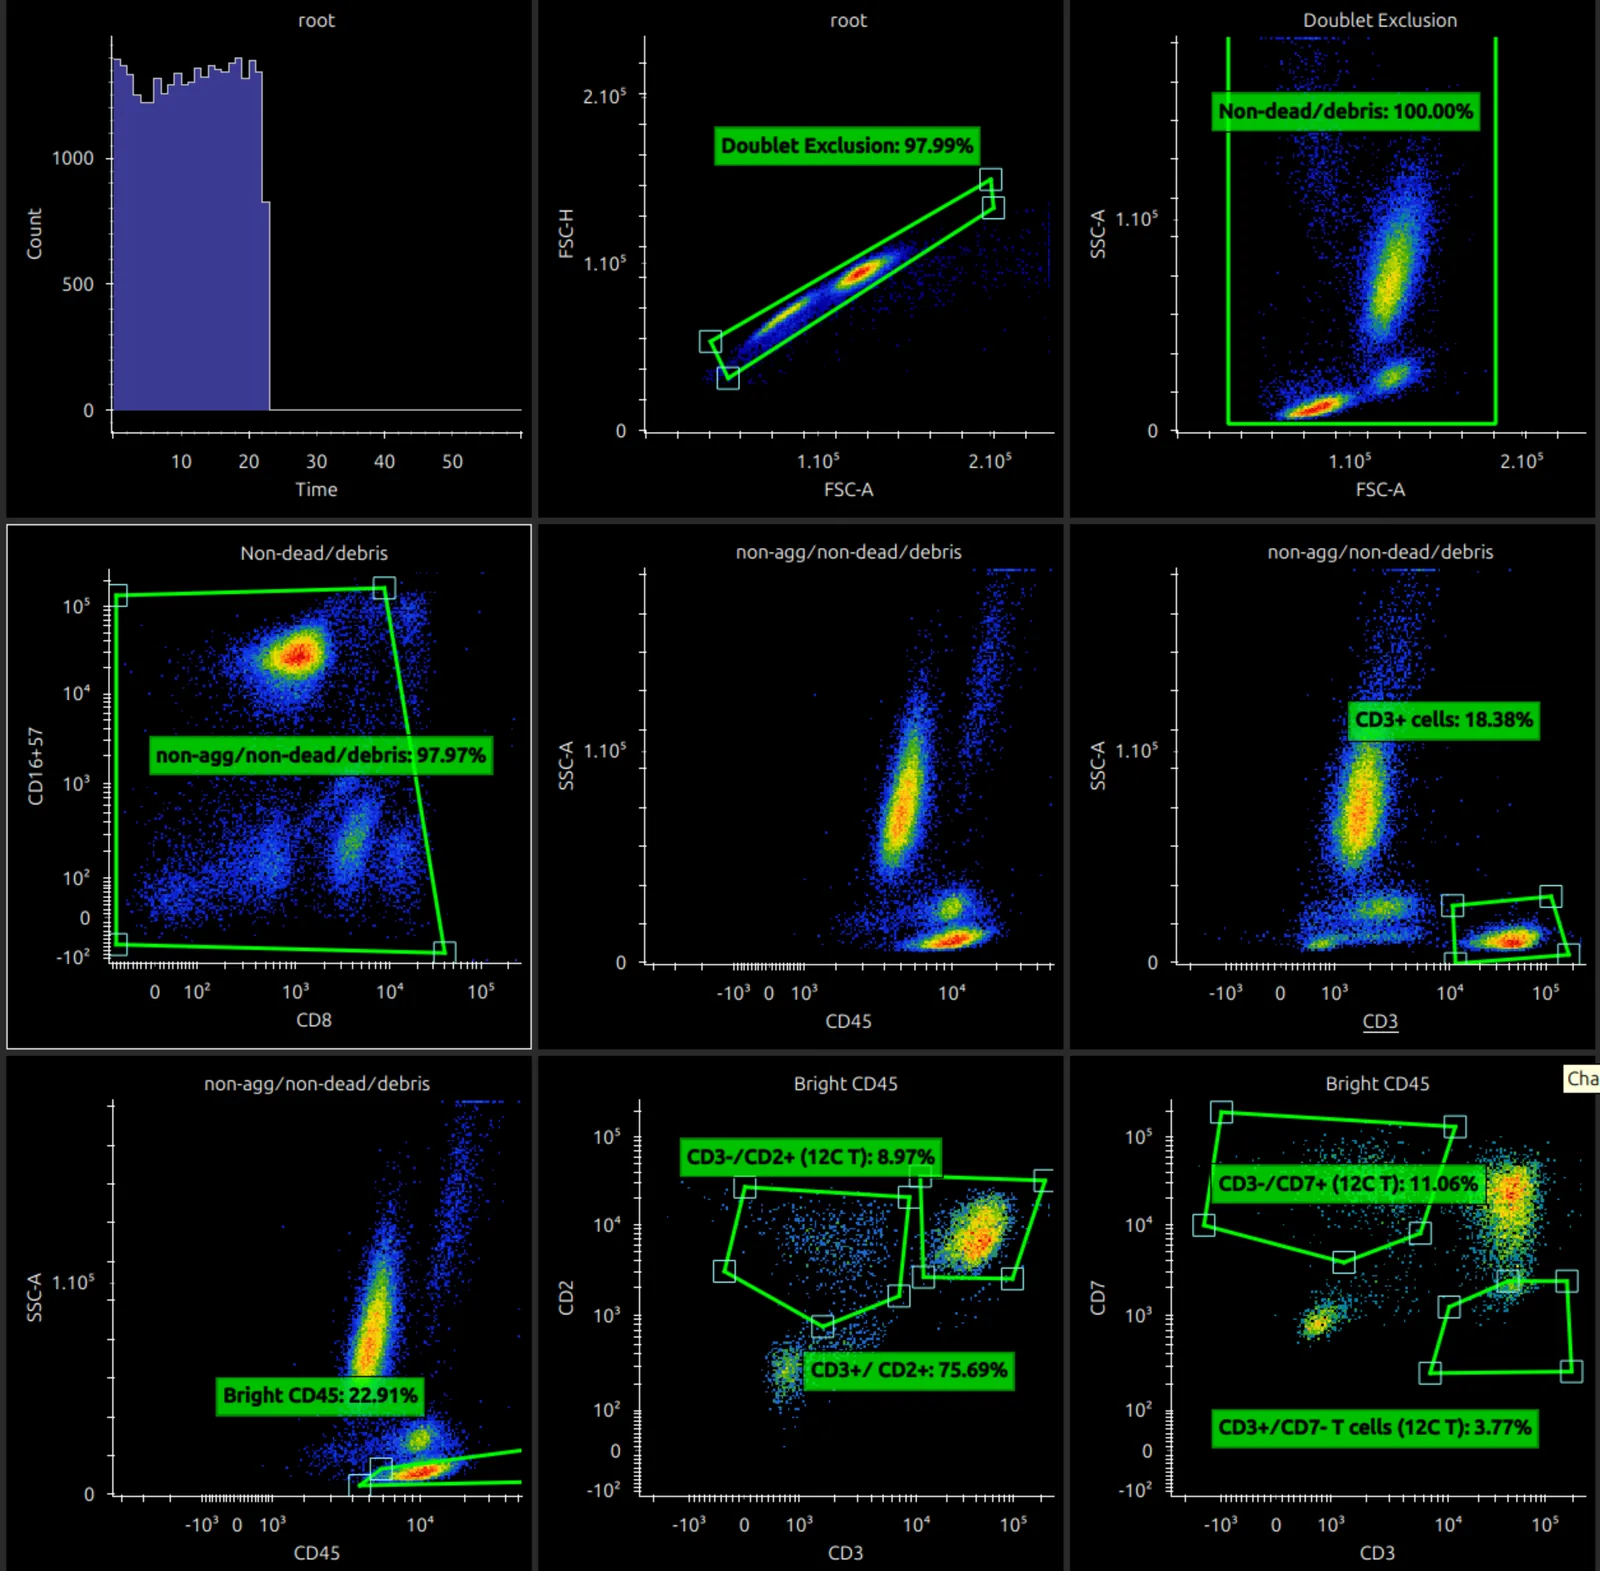
When a plot is selected, the middle of the toolbar has buttons that move it to the start, left, right or end.

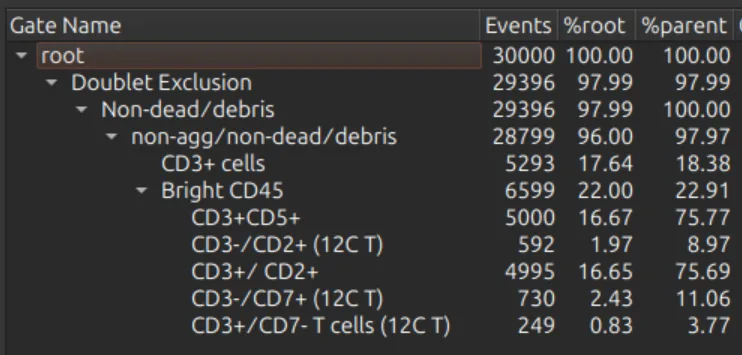
The gating hierarchy is shown on the right when it is switched on.
Channels, source gate and transforms
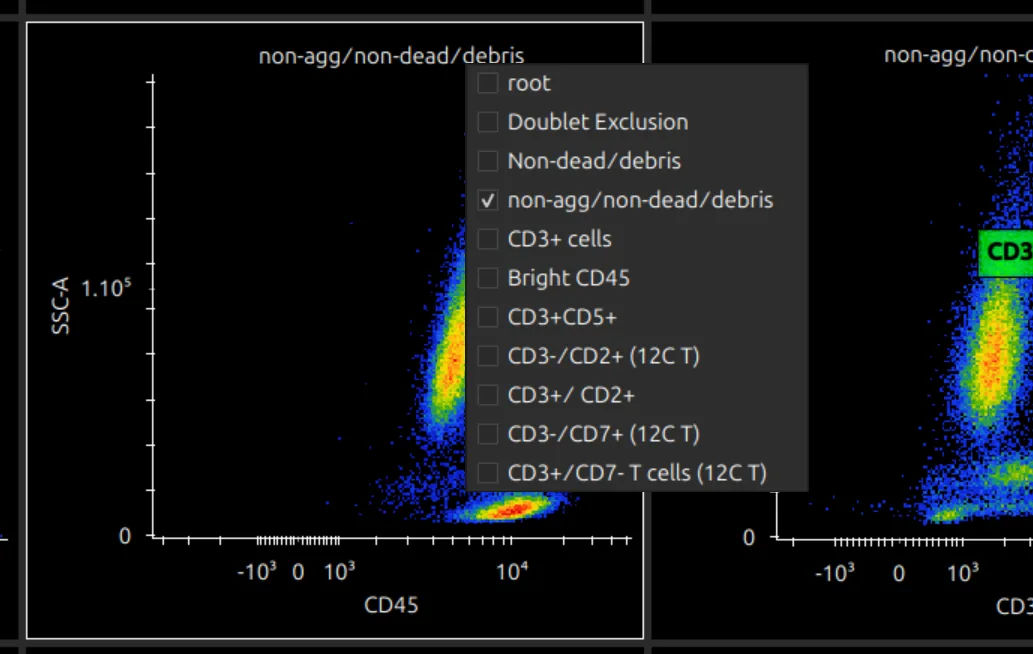
- Click an axis title to choose its channel, and the plot title to choose the source gate (the population the plot shows). Once gates are drawn on a plot, these choices are limited.
- Choose Count on the y axis to make a 1D histogram, and All Fluorescence on the x axis to make a ribbon plot.
- In the Unmixed Data tab with per-cell autofluorescence, the AF Abundance and AF Index channels can be plotted and gated like any marker.
Right-click an axis to change its transform: linear, log or logicle. On a logicle axis, drag near the top of the scale to change the full range, and near the bottom to change the width of the linear region around zero.
Pop out a plot
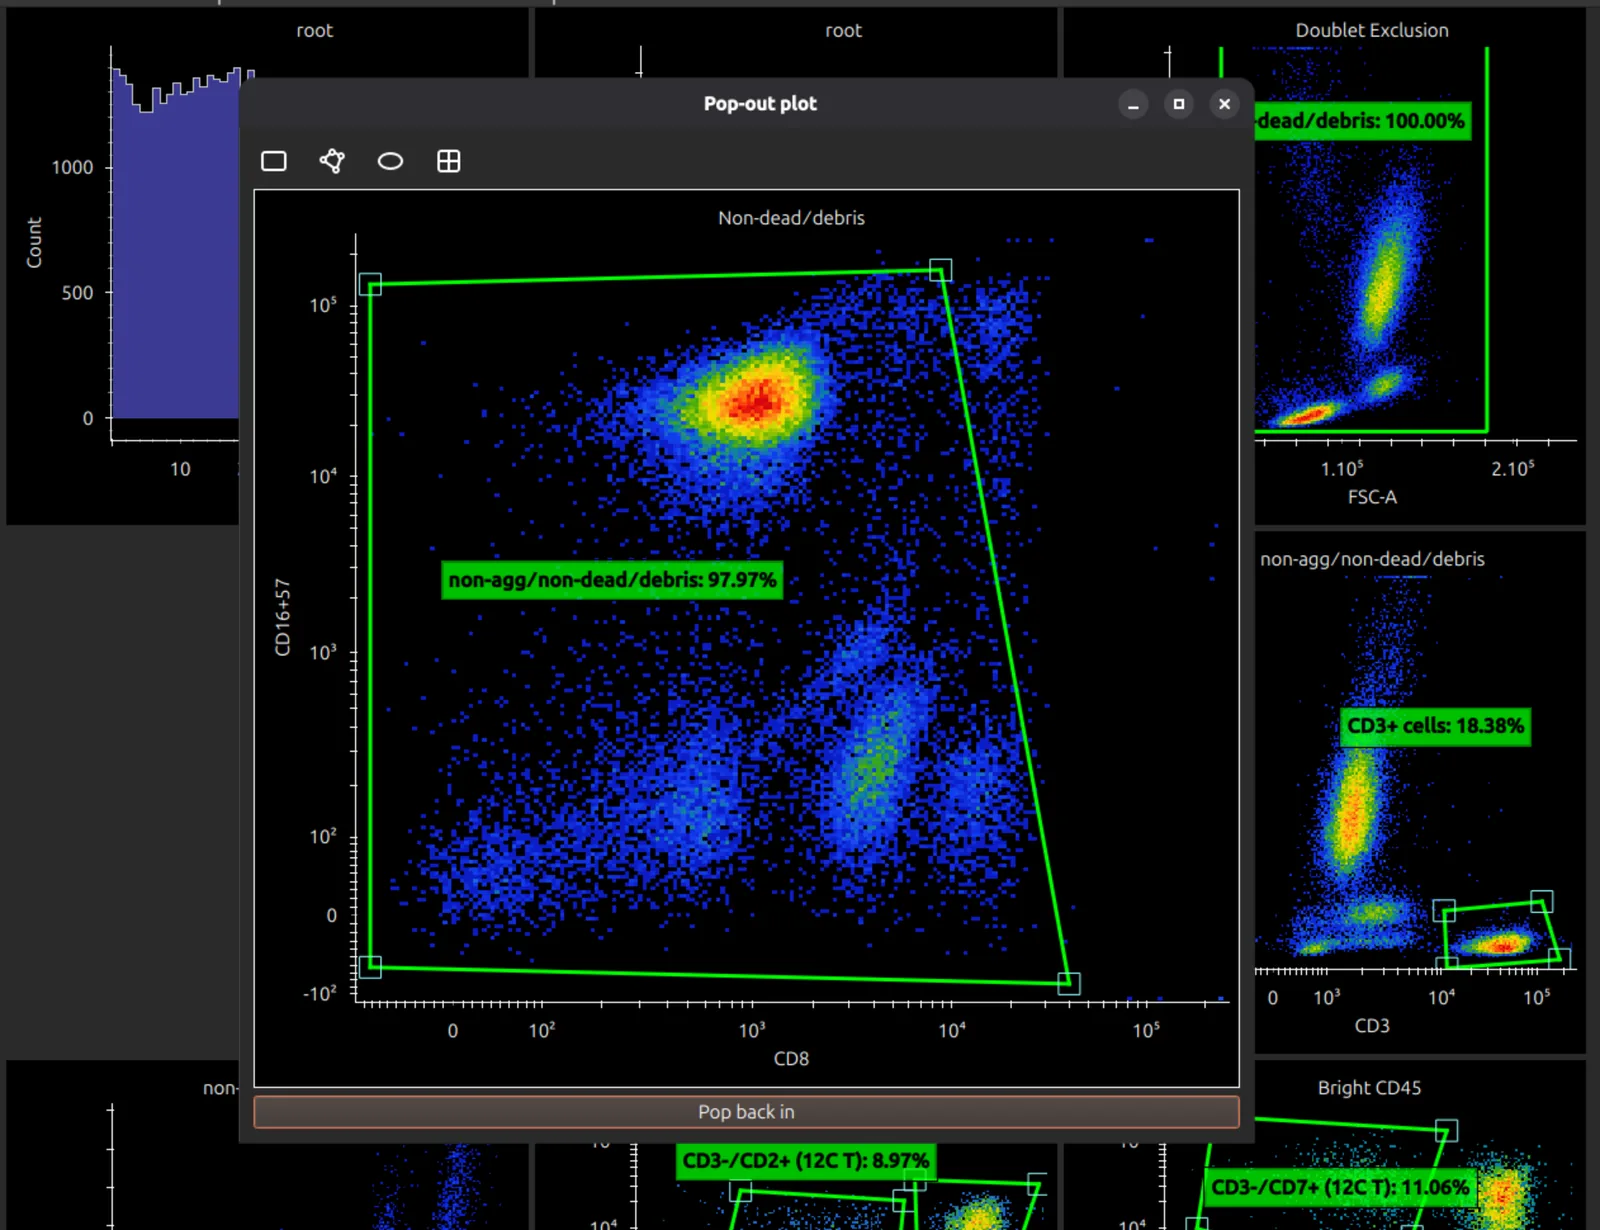
Double-click a plot to open it in its own window, where it is large enough to place gates precisely. Close the window to put it back.
Draw and edit gates
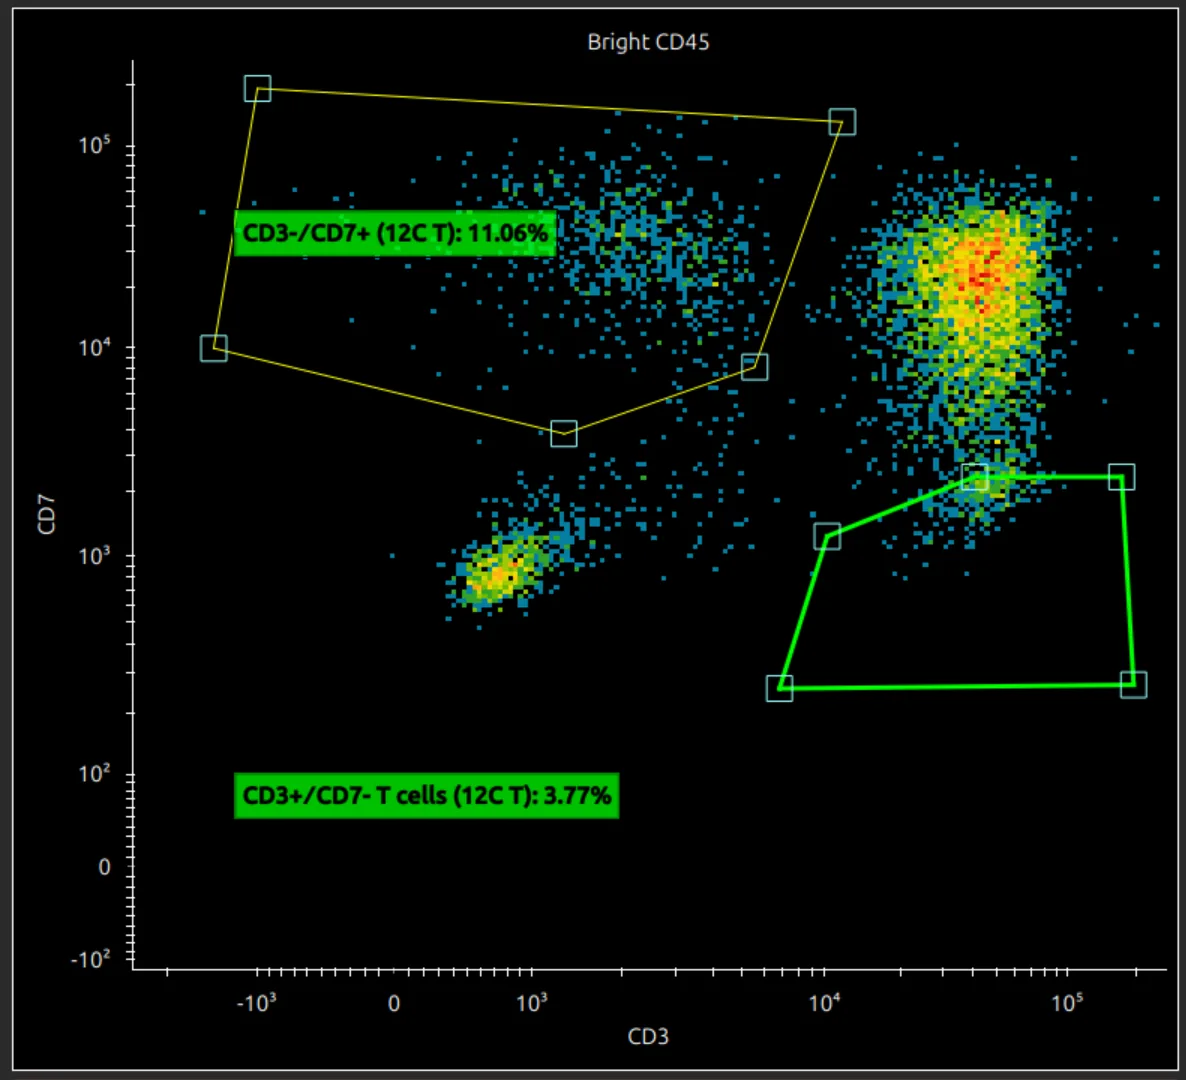
With a 2D plot selected, the toolbar offers rectangle, polygon, ellipse and quadrant gates.

With a 1D plot selected, it offers a range gate.

Hover over a gate to see what you would select: the whole gate, a line or a vertex. With a polygon gate you can:
- click a highlighted line to add a vertex;
- right-click a highlighted vertex to remove it;
- drag the whole gate when it is highlighted.
Drag a gate’s label to move it, and double-click the label to rename the gate.
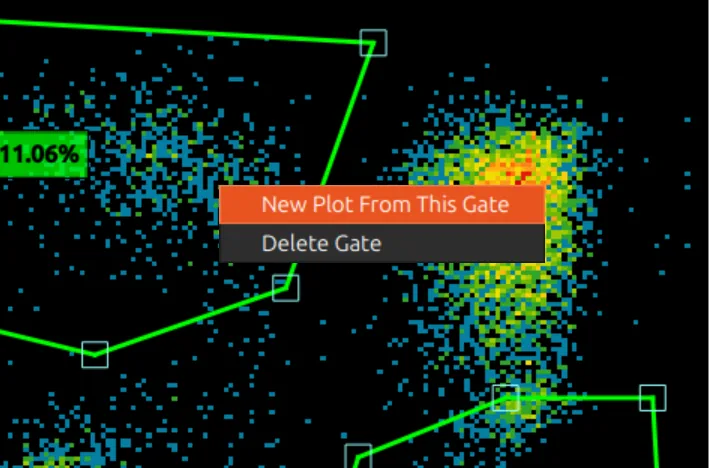
Right-click a gate to make a new plot of that population, delete the gate, or customise it for the current sample.
All samples share one gating template, so a gate you draw or move applies to every sample. To give one sample a different gate, see Per-sample gating.
Display options
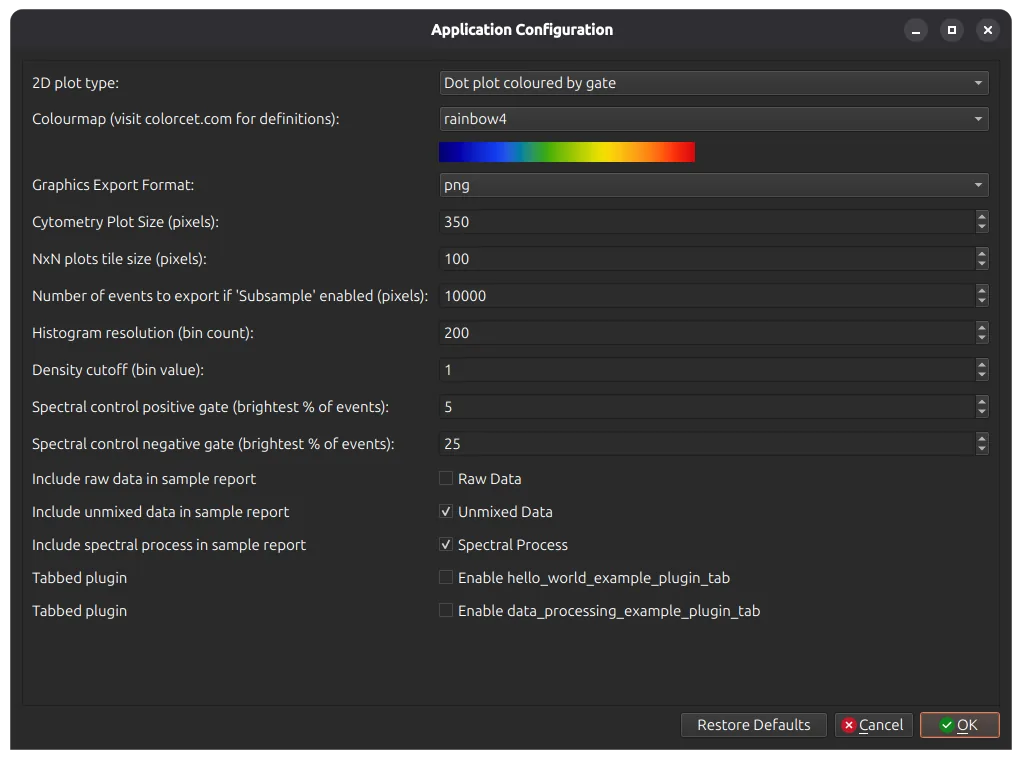
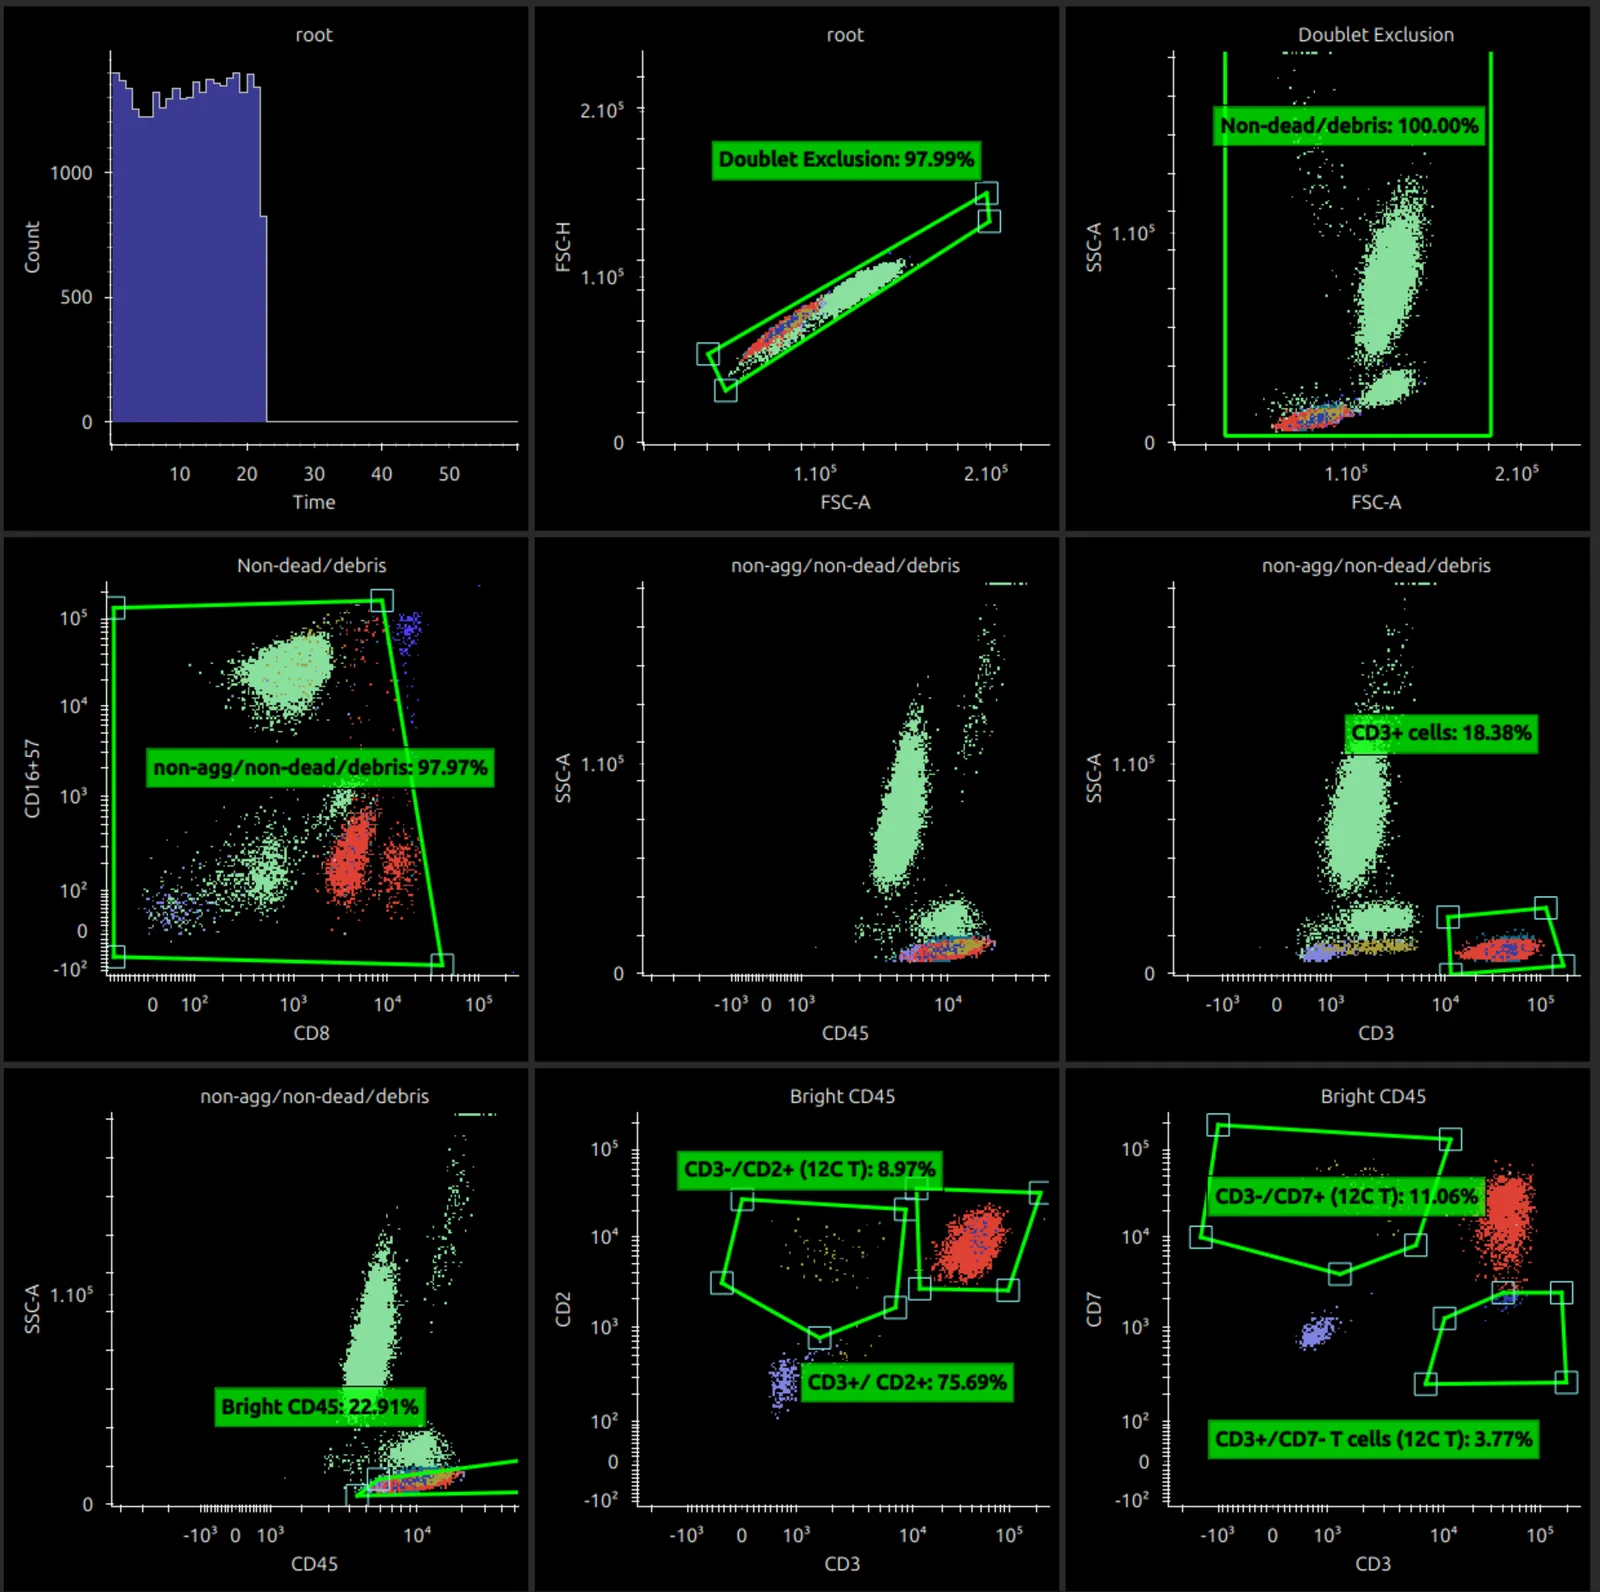
Edit > App Configuration has several options for plots, including the colour map and the size of plots. Set 2D plot type to Dot Plot Coloured by Gate to show coloured dot plots; the main window reloads.
Next steps
Further reading
- Parks DR, Roederer M, Moore WA. A new “Logicle” display method avoids deceptive effects of logarithmic scaling for low signals and compensated data. Cytometry A 2006;69(6):541–551. doi:10.1002/cyto.a.20258