
Spectral unmixing
Create an experiment, import FCS files, build a spectral model from single-stained controls, then unmix and check the result.
This guide takes you from FCS files to unmixed data. It uses the AutoSpectral Full Workflow Example, a 9-colour panel run on a 5-laser Cytek Aurora. To follow along, download the data from the AutoSpectral Full Workflow Example post (it links to the files on Mendeley Data) and unzip them. If you have not installed Honeychrome yet, see Install.
Create an experiment
Start Honeychrome and choose New Experiment. Type a name, for example “AutoSpectral Full Workflow Example”. This creates a .kit file, which holds the experiment’s settings, and a folder of the same name for the FCS files, exports and reports.
Import your FCS files
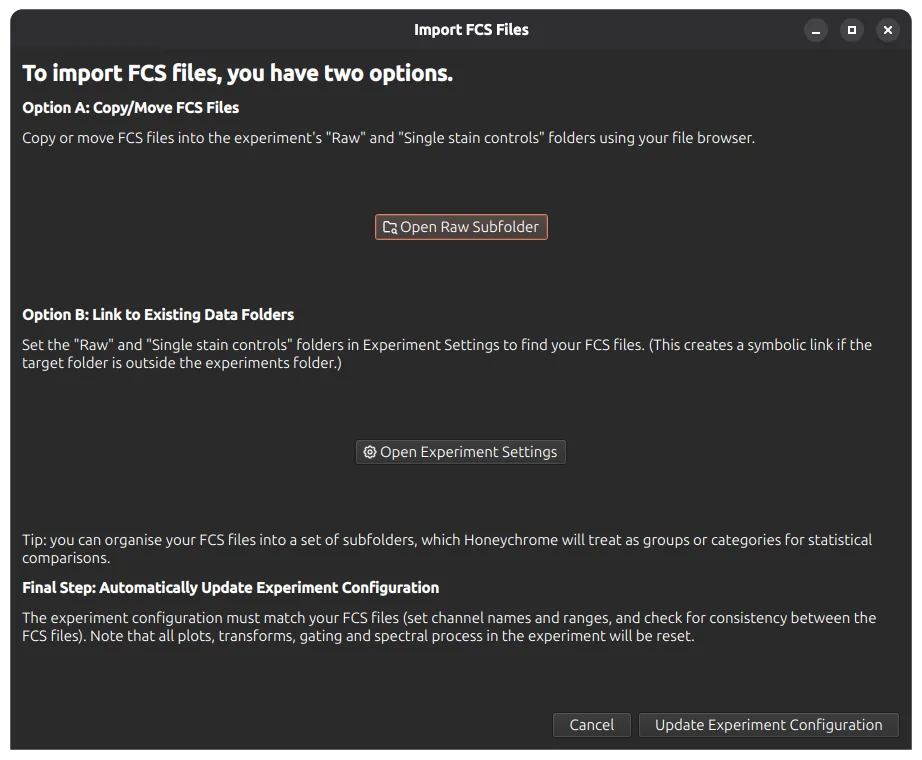
Choose File > Import FCS Files. You can either copy or move your FCS files into the experiment’s Raw folder, or link to an existing data folder.
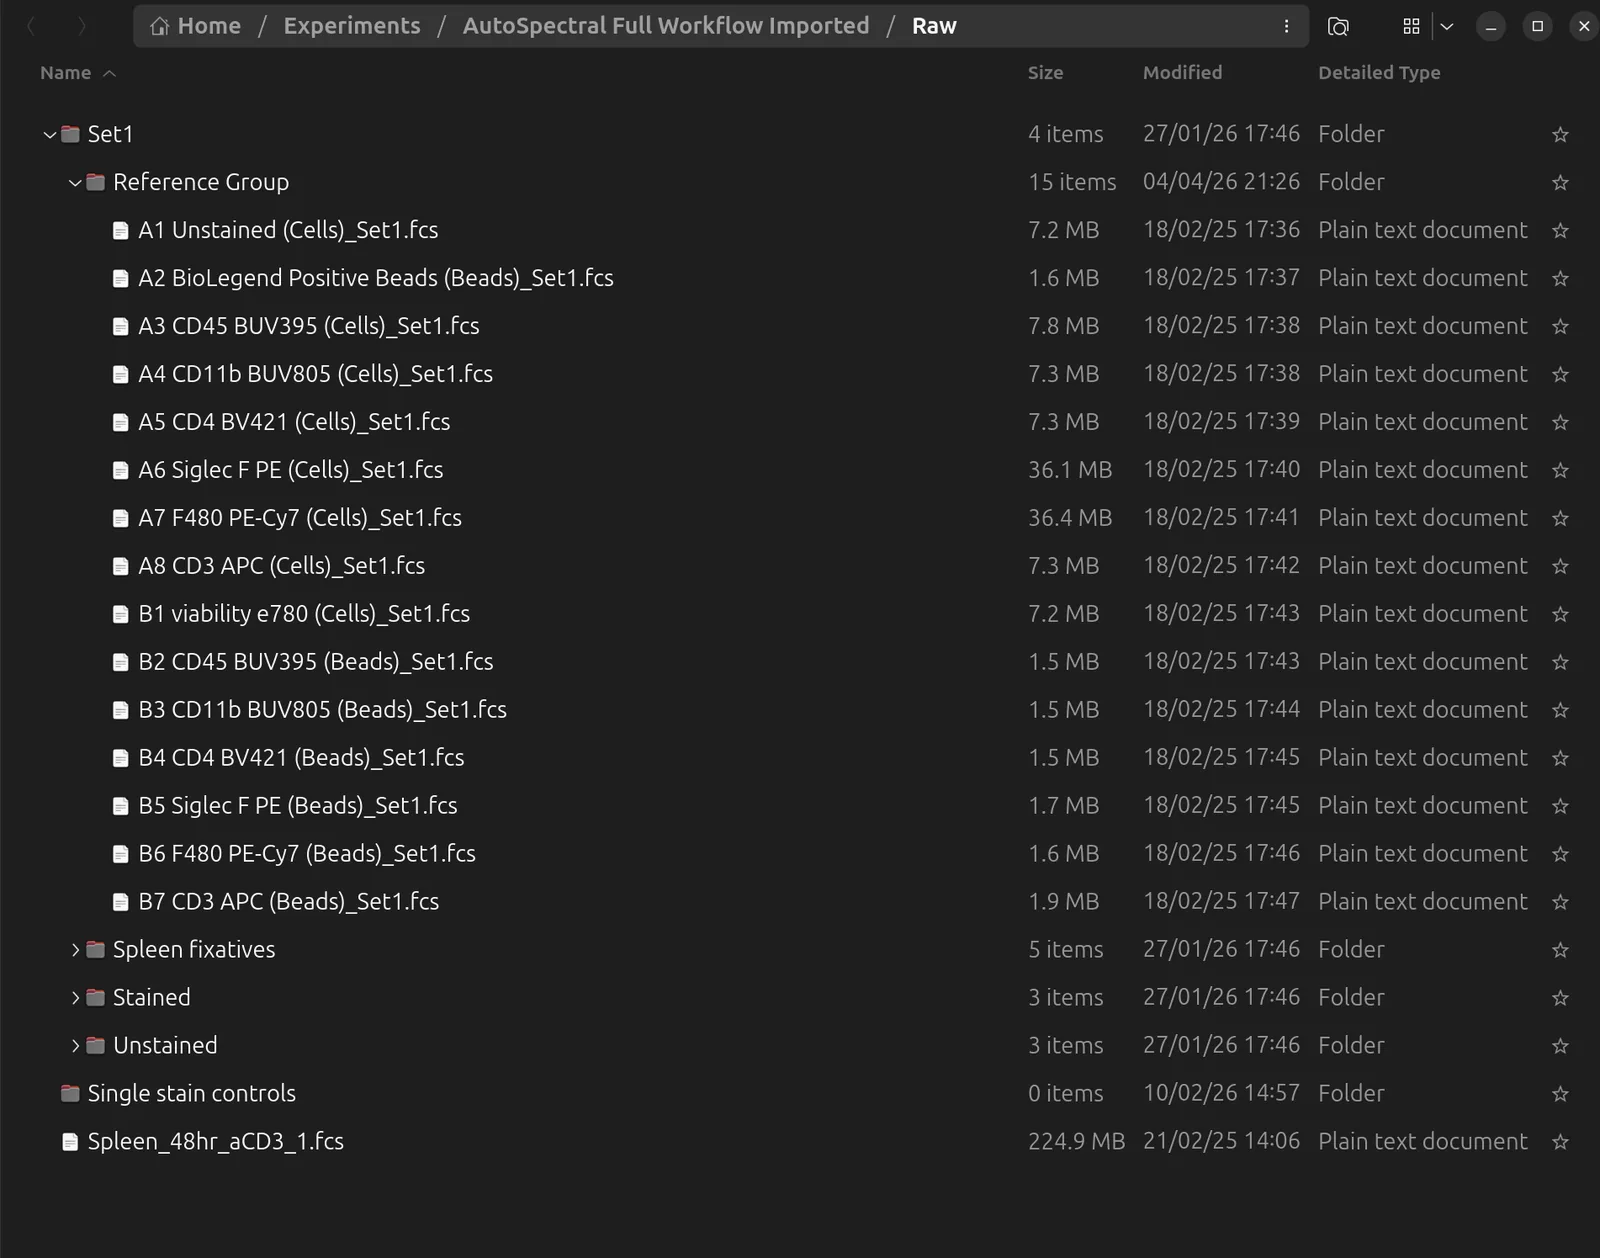
Honeychrome keeps the folder structure of your files and shows the same folders in the sample browser on the left. Folders are also used as sample groups later, for example in Simple Stats and when assigning autofluorescence profiles.
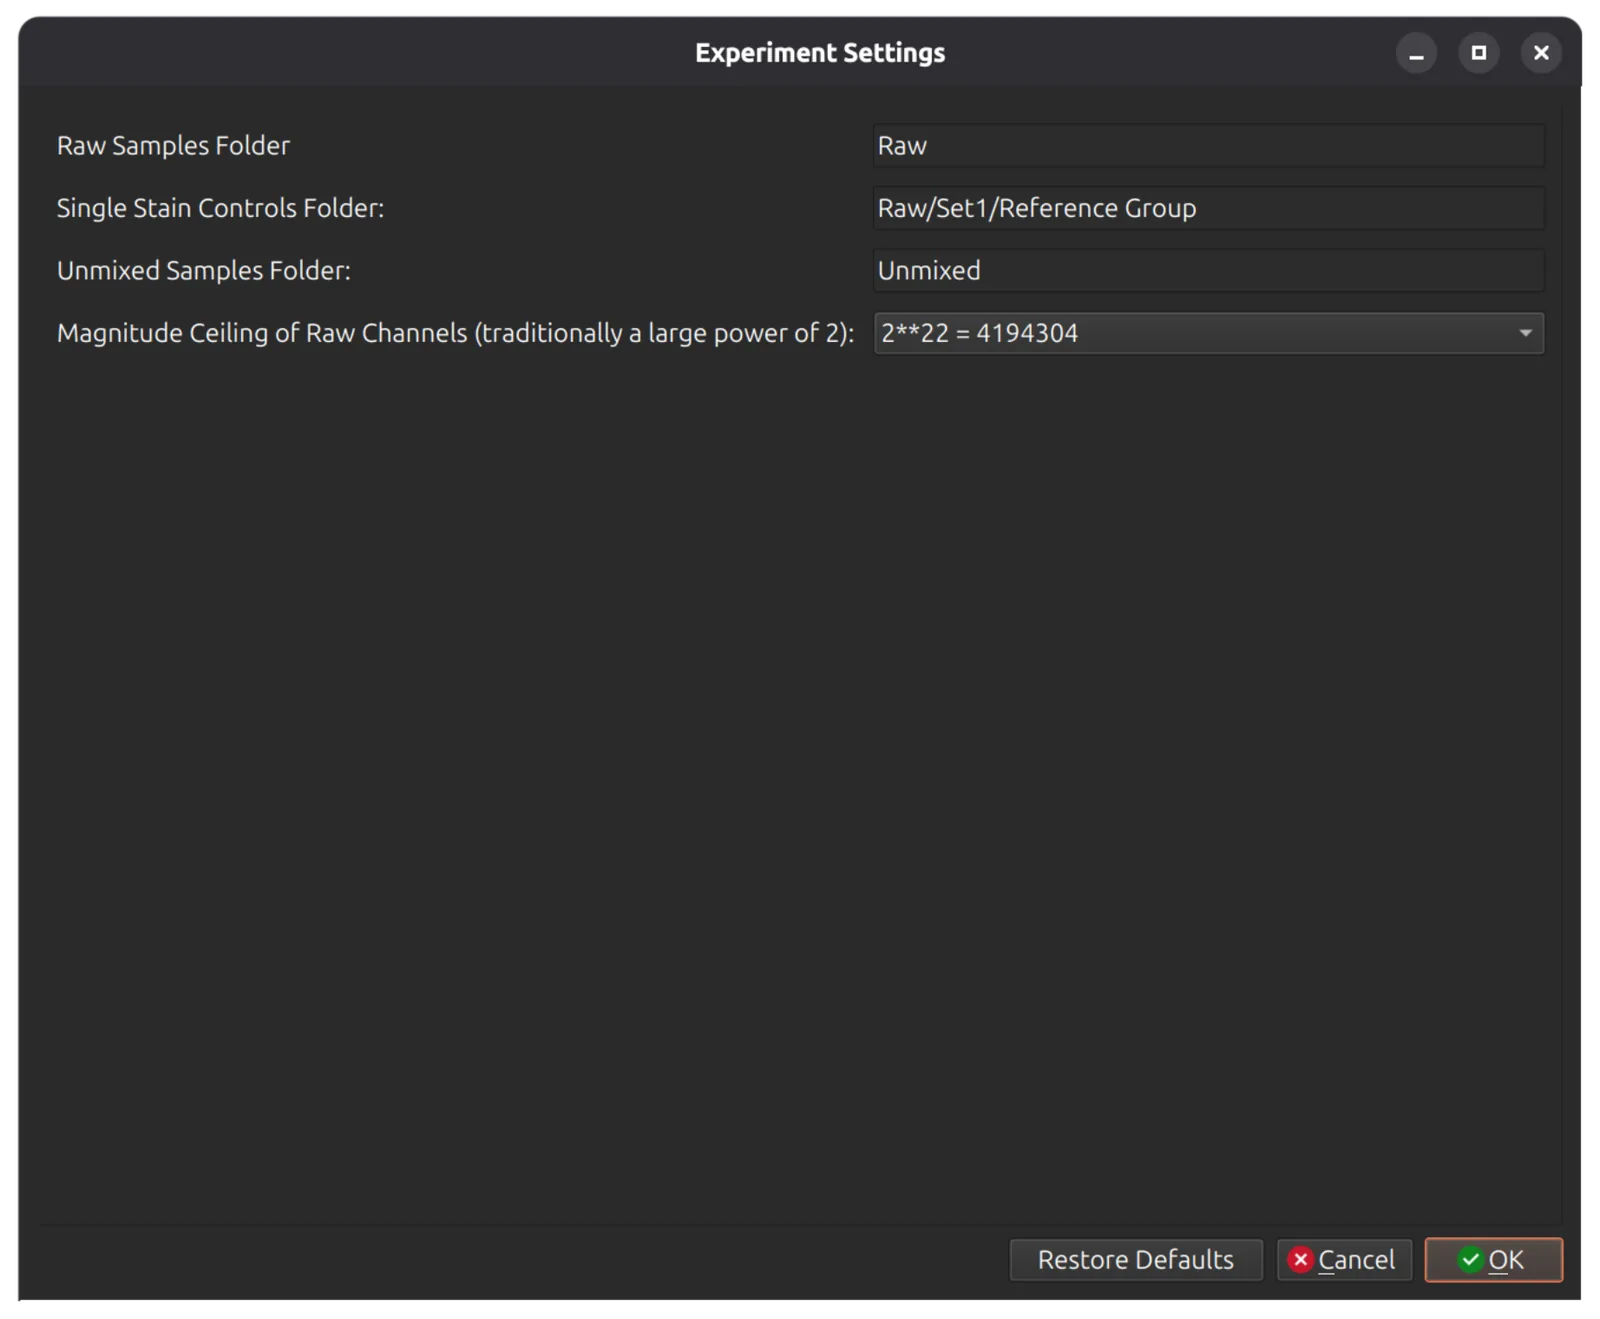
Tell Honeychrome where the single-stained controls are. Open Edit > Experiment Settings (or use the button in the import dialog) and click single stained controls to choose the folder.
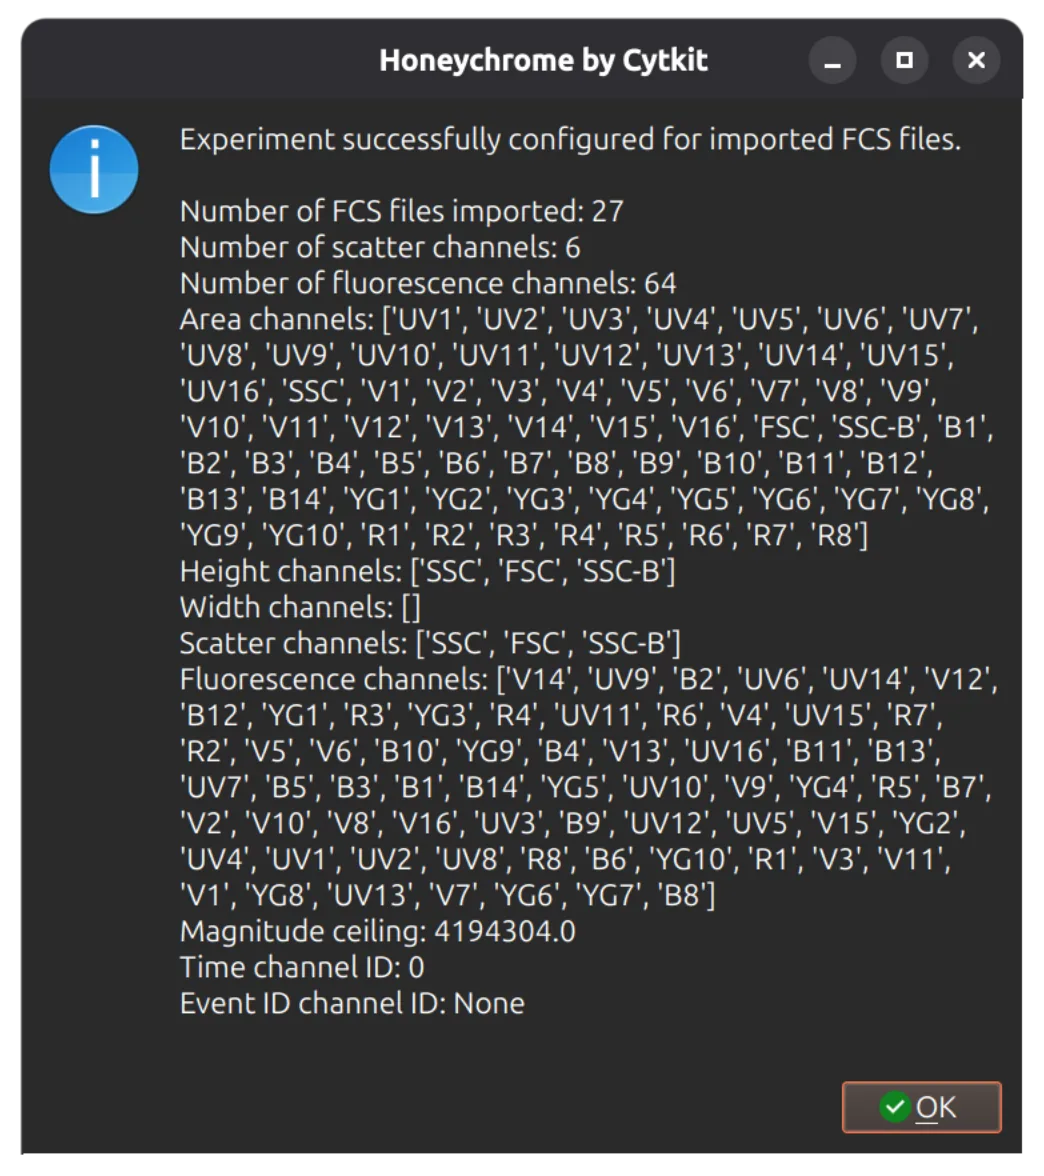
Then click Update Experiment Configuration at the bottom of the dialog. Honeychrome reads the channels of every file and checks that they are consistent. If the detector voltages or gains differ between files, it warns you, because Honeychrome does not adjust for them.
Check the raw data
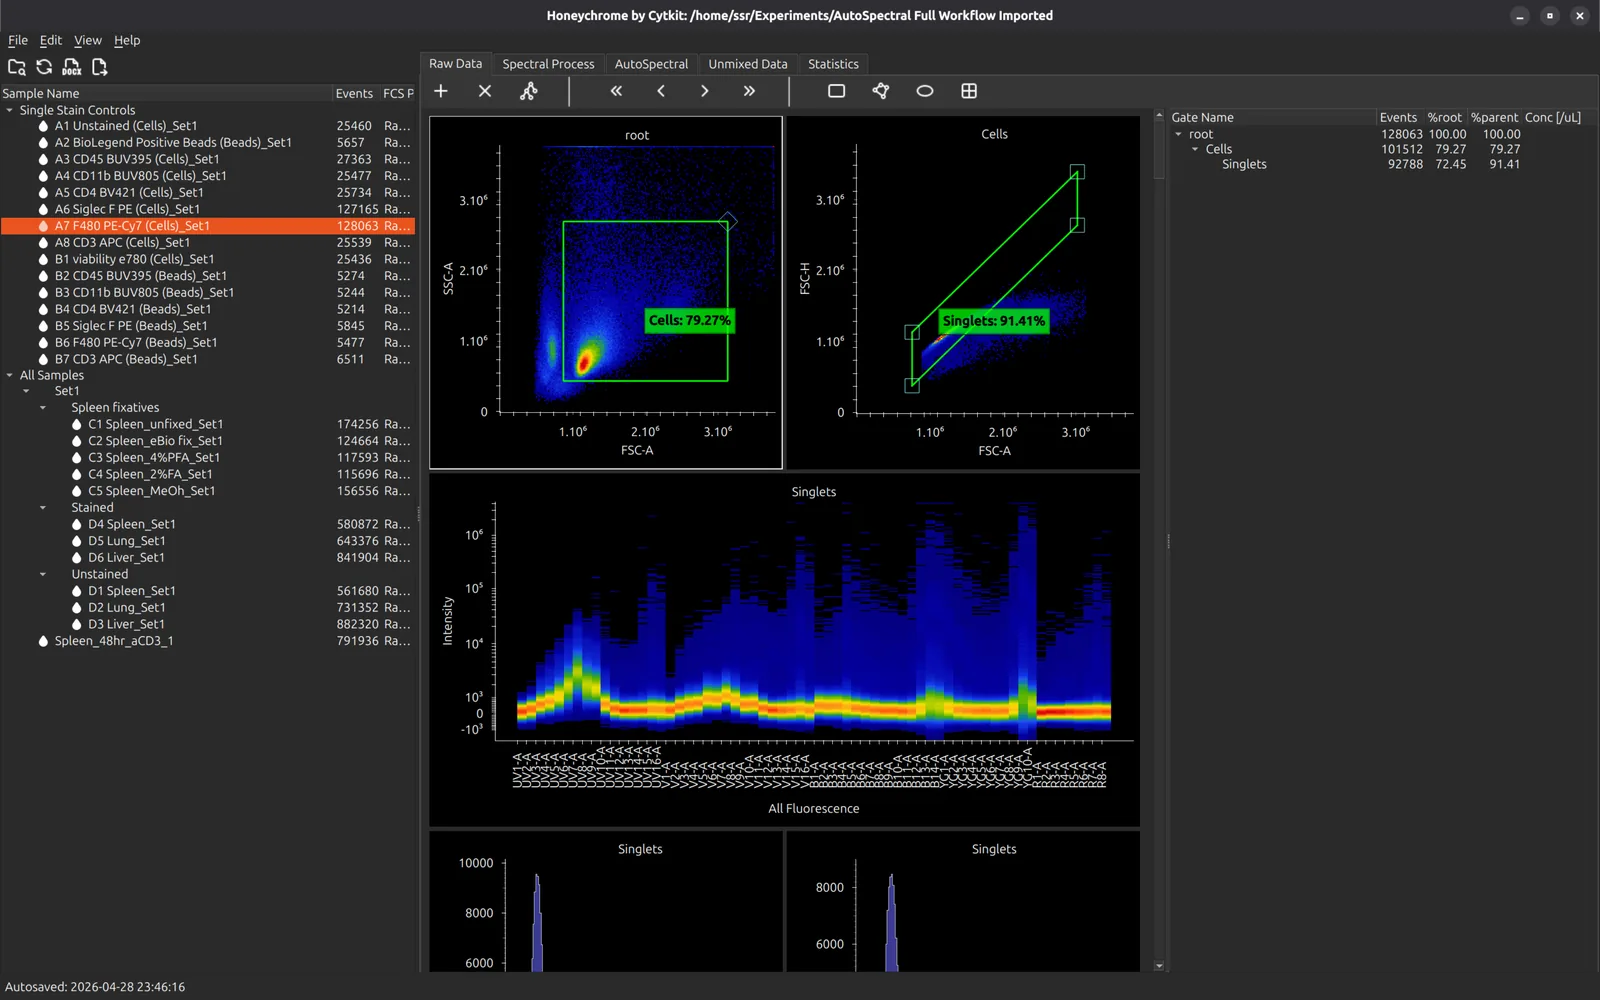
Click any sample in the sample browser to load it. The Raw Data tab shows morphology plots, a ribbon plot of every detector, and histograms.
Set broad scatter gates here that keep every cell of interest, large and small, but not doublets. The spectral controls use them.
You can draw gates on the raw data, but do your analysis in the Unmixed Data tab, once the spectral model is built.
Unstained and bead samples
The sample browser marks two kinds of sample, and you can change either with a right click:
- Unstained samples have a blue droplet icon. Files with “unstained” in the name are recognised automatically. Use Mark as Unstained or Unmark as Unstained for others.
- Bead samples are shown in green. Unstained samples and single-stained controls whose scatter looks like beads are marked automatically. Use Mark as Beads or Unmark as Beads to correct it; your choice is final.
Unstained, single-stained and bead samples are left out by default when you choose samples for analysis.
Build the spectral model
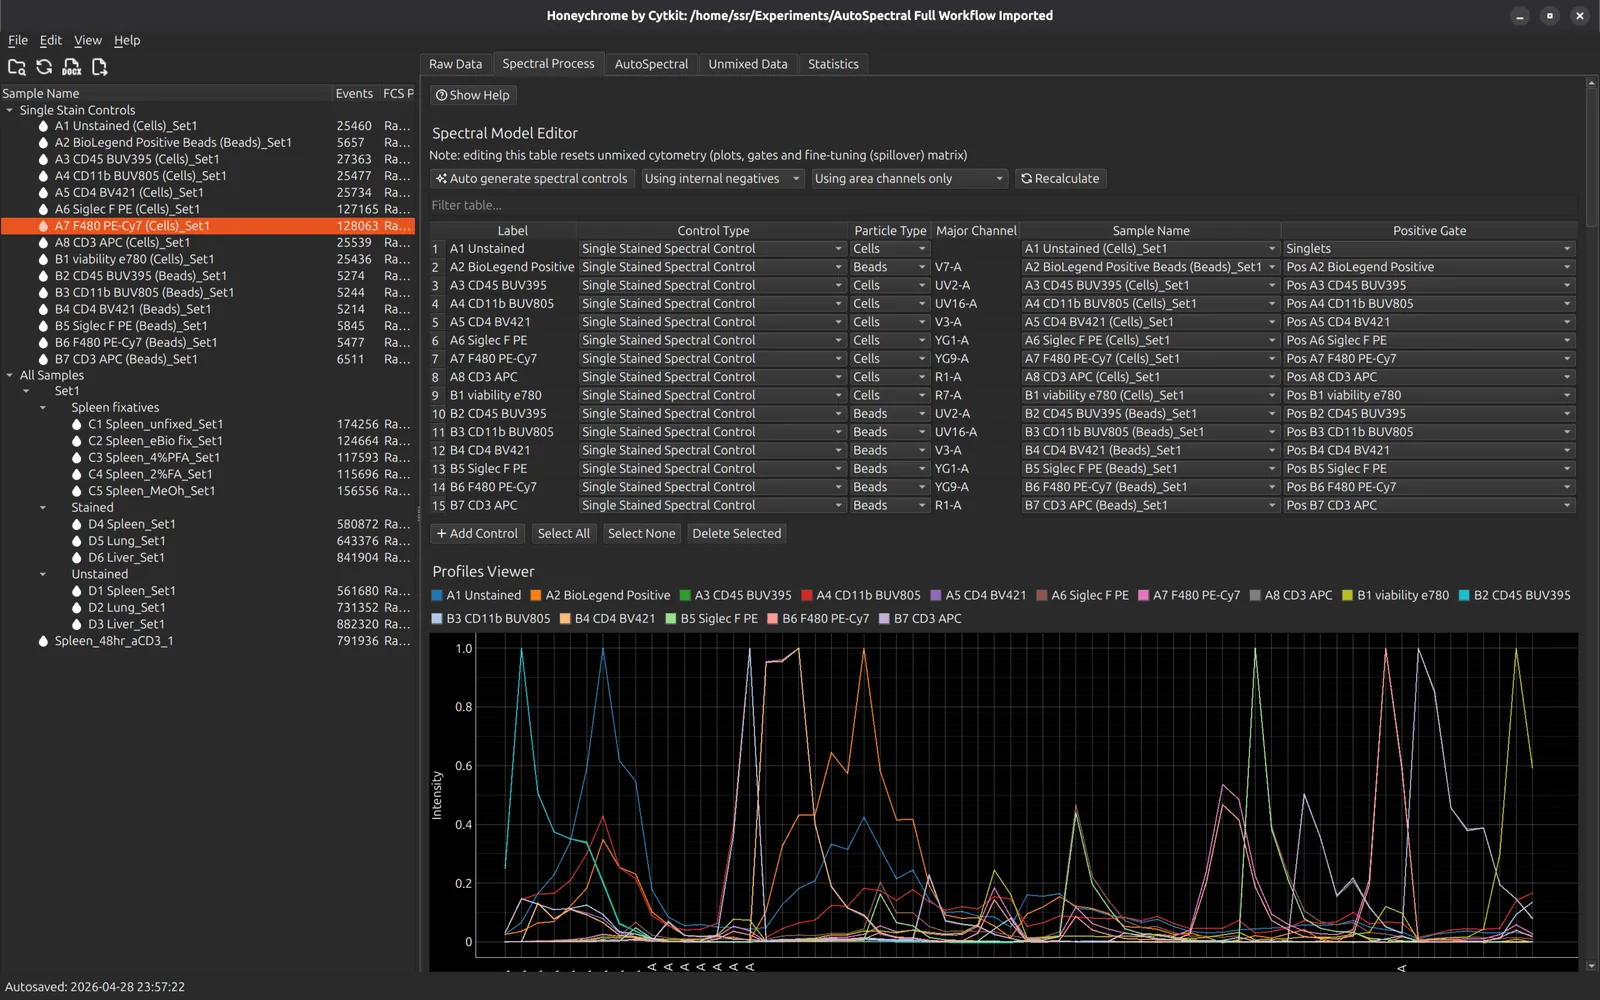
Open the Spectral Process tab and press Auto generate spectral controls. Honeychrome makes one control for each file in the single-stained controls folder:
- The label comes from the start of the file name, and antigen and fluorophore names are recognised.
- The particle type comes from the name, for example “CD4 BUV395 (Cells)” or “(Beads)”. When the name does not say, Honeychrome decides from the scatter, and bead controls are matched to the right unstained bead sample when there are several bead types.
- The major channel is the detector where the fluorophore varies most. A positive gate is placed on the brightest events and a negative gate on the dimmest (5% and 25% by default, set in App Configuration). The gates are added to the raw data plots, where you can adjust them.
Choose the negative
Each spectrum is the mean of the positive events minus a negative:
- Using internal negatives (the default) takes the dimmest events of the same control.
- Using unstained negative takes an unstained sample instead, which is usually better. Choose the unstained sample for each control in the Unstained Negative column, or for all at once with Set negative for all.
With an unstained negative and Automatically Clean ticked (the default), AutoSpectral control cleaning runs straight after the controls are generated. See Control cleaning.
Tidy the controls
This example has both cell and bead controls for some fluorophores. Select the bead controls and press Delete Selected. You can also rename labels here, or go back to the Raw Data tab and adjust the gates of a control.
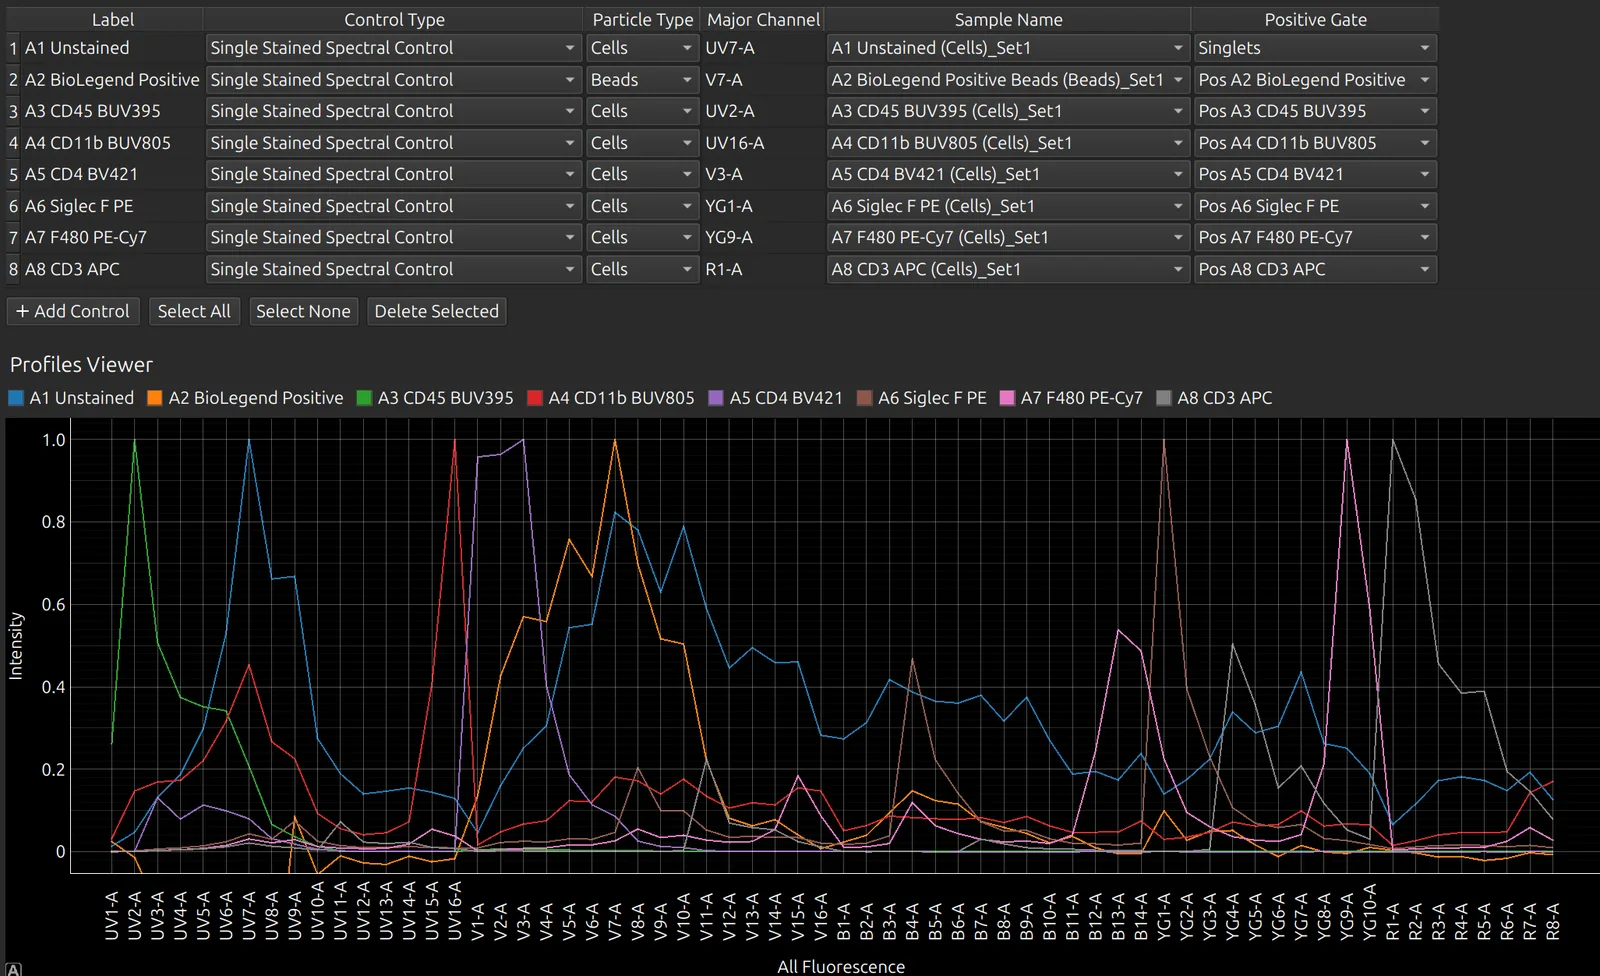
If you change the sample of a control, for example from cells to beads, its particle type and negative follow the new sample. Its gates are placed again, and it is cleaned again if Automatically Clean is on.
Unmixed gates are kept when the spectral model is regenerated.
Use a spectrum from the Reference Library
If a control has failed, use a spectrum from the Reference Library instead:
- Set the control’s Control Type to Single Stained Spectral Control from Library.
- Enter the fluorophore as the label.
- Choose a match under Sample Name. Only spectra recorded on the same instrument and detector configuration are offered.
To add one of your own controls to the library, right-click it in the spectral model editor and choose Save to Reference Library. View > Reference Library opens the library itself, where you can browse, compare, import and export spectra for your instrument.
Check the spectral model
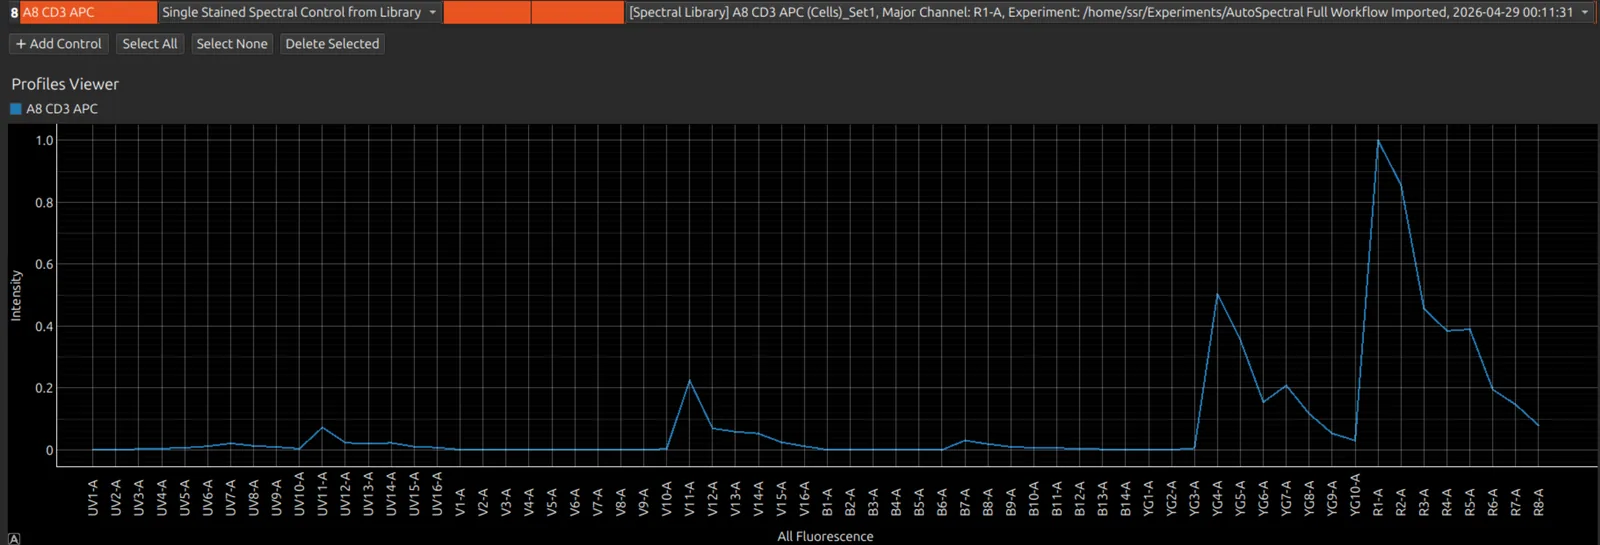
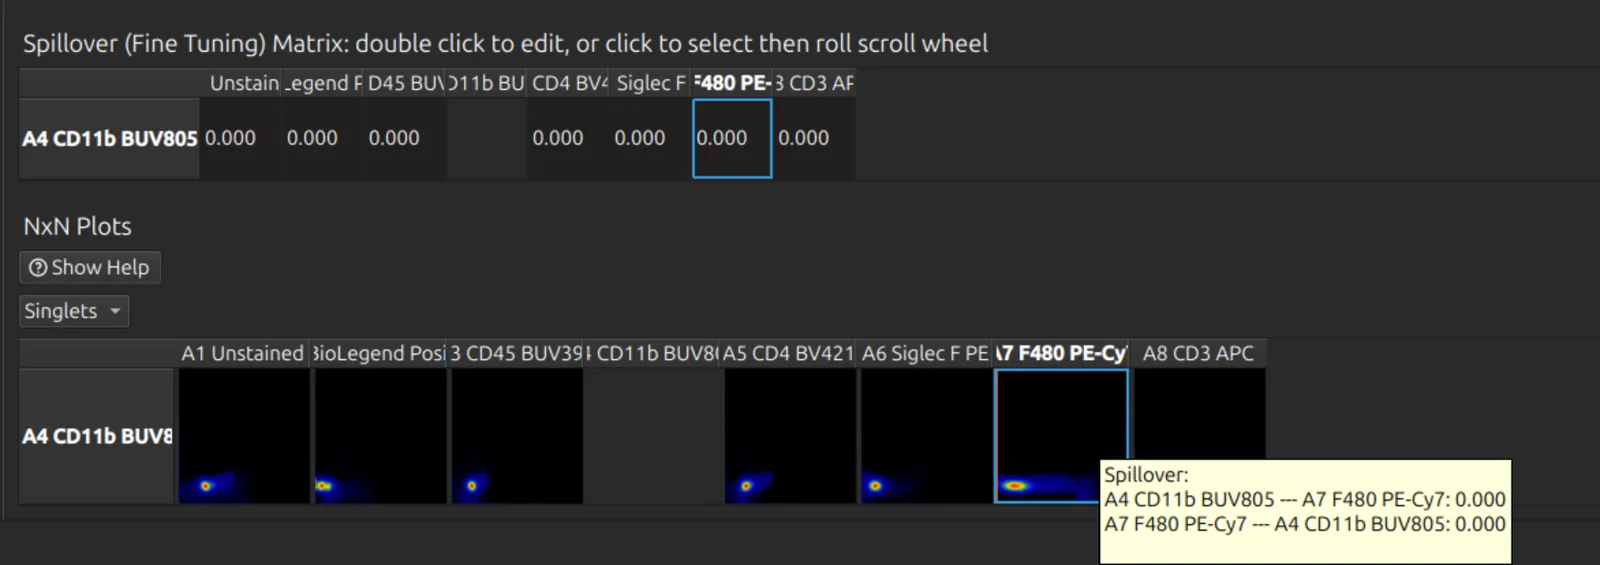
Select one or more controls in the table to show only their spectra, and only their rows of the matrices and NxN plots. This makes large panels much easier to work with.
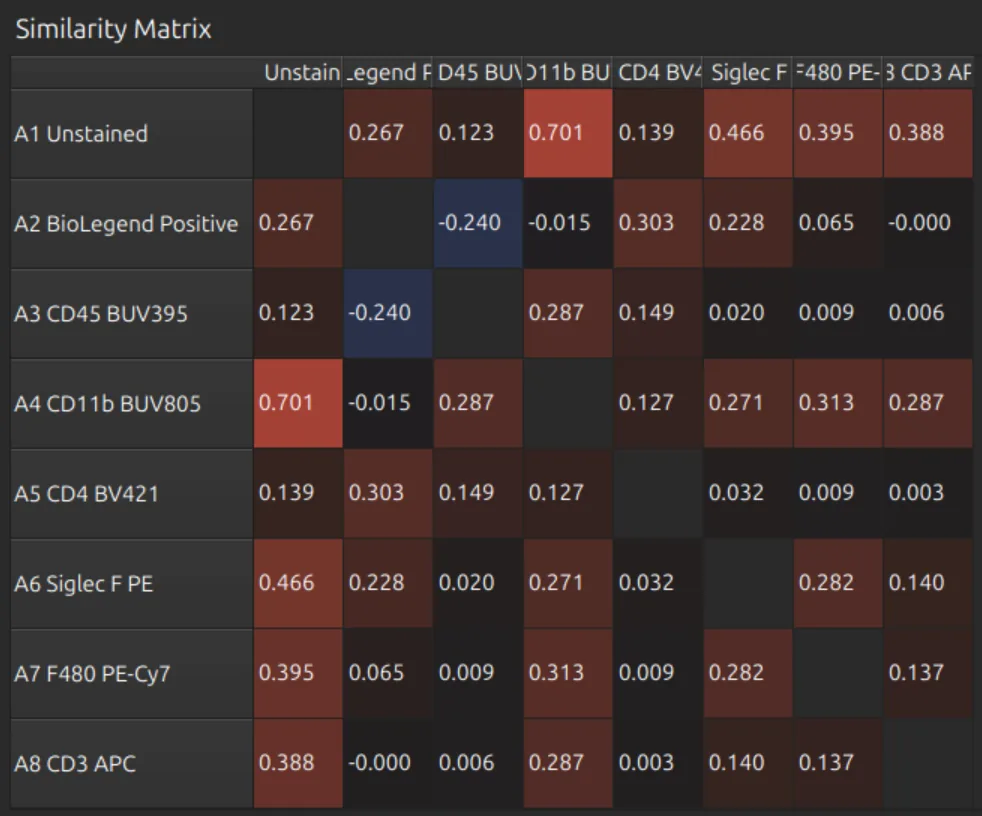
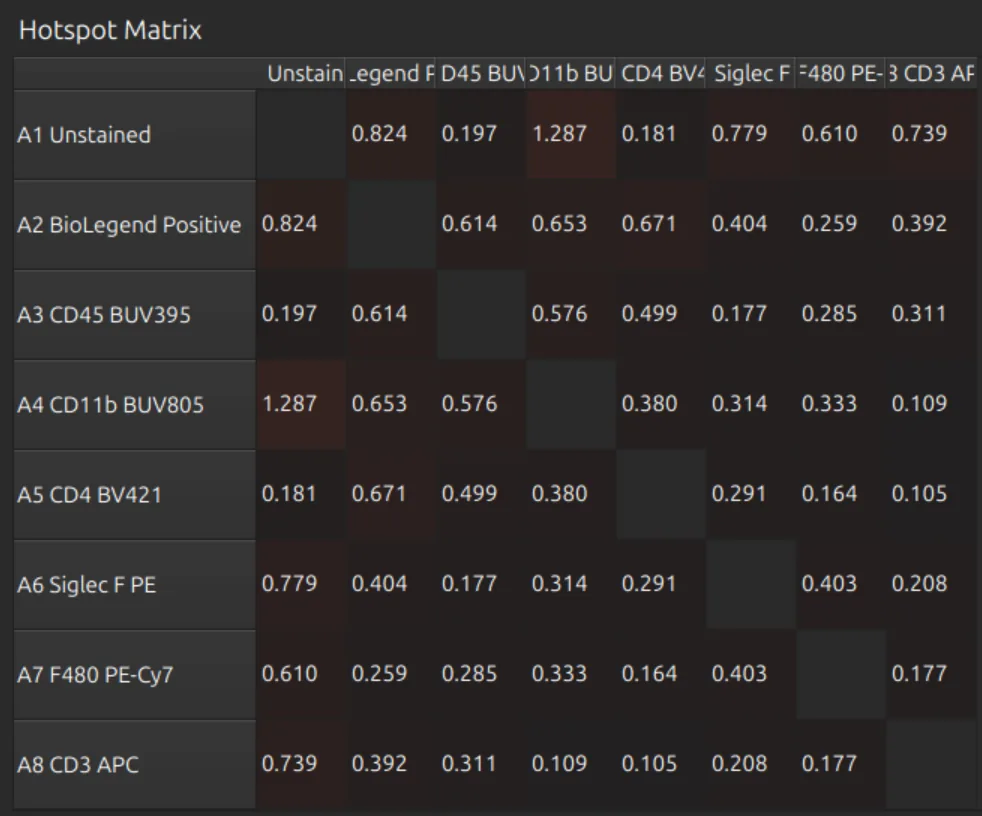
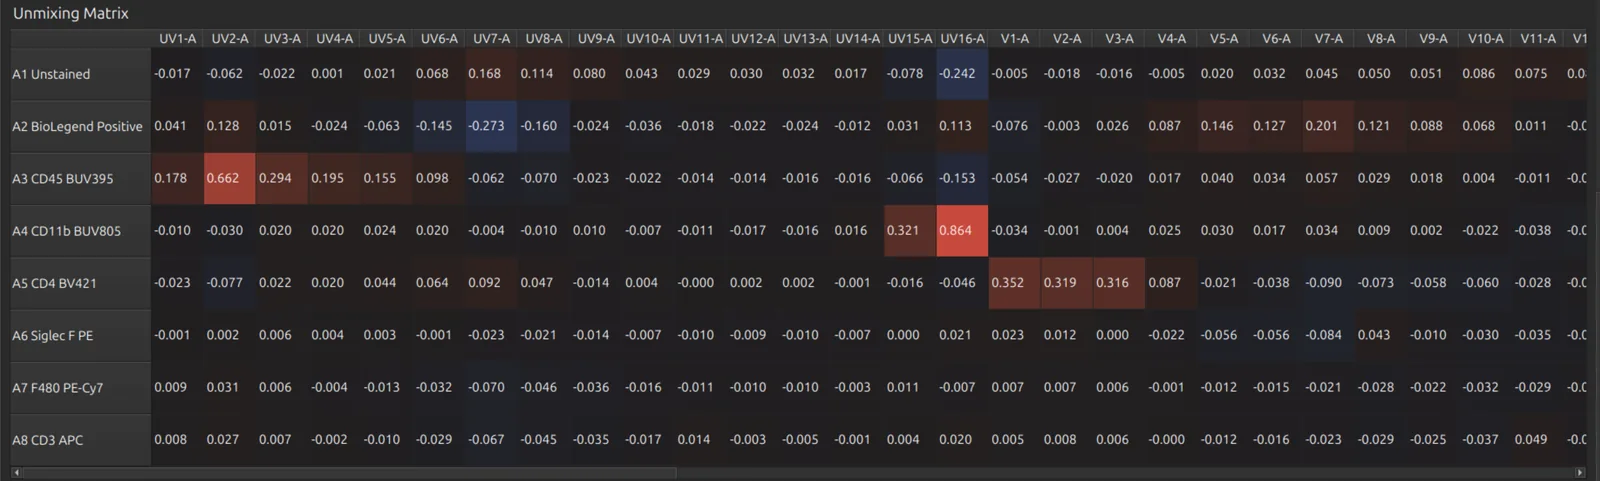
Press Select None (or Select All) to see every spectrum and the full matrices:
- the similarity matrix: how alike each pair of spectra is;
- the hotspot matrix: where unmixing will spread signal between fluorophores;
- the unmixing matrix.
The condition number of the spectral model is shown above the table. Higher values mean less stable unmixing, and Honeychrome warns about a poorly conditioned matrix.
Fine tune
The spillover matrix and the NxN plots let you fine tune the unmixing by hand. The NxN plots show every pair of unmixed labels for the sample selected in the sample browser.
- Click a cell of the spillover matrix or a tile of the NxN plots, then roll the mouse wheel to adjust it. You must click first, so scrolling the page cannot change the spillover by accident.
- Double-click a cell of the spillover matrix to type a value.
- Hover over a tile to see its spillover.
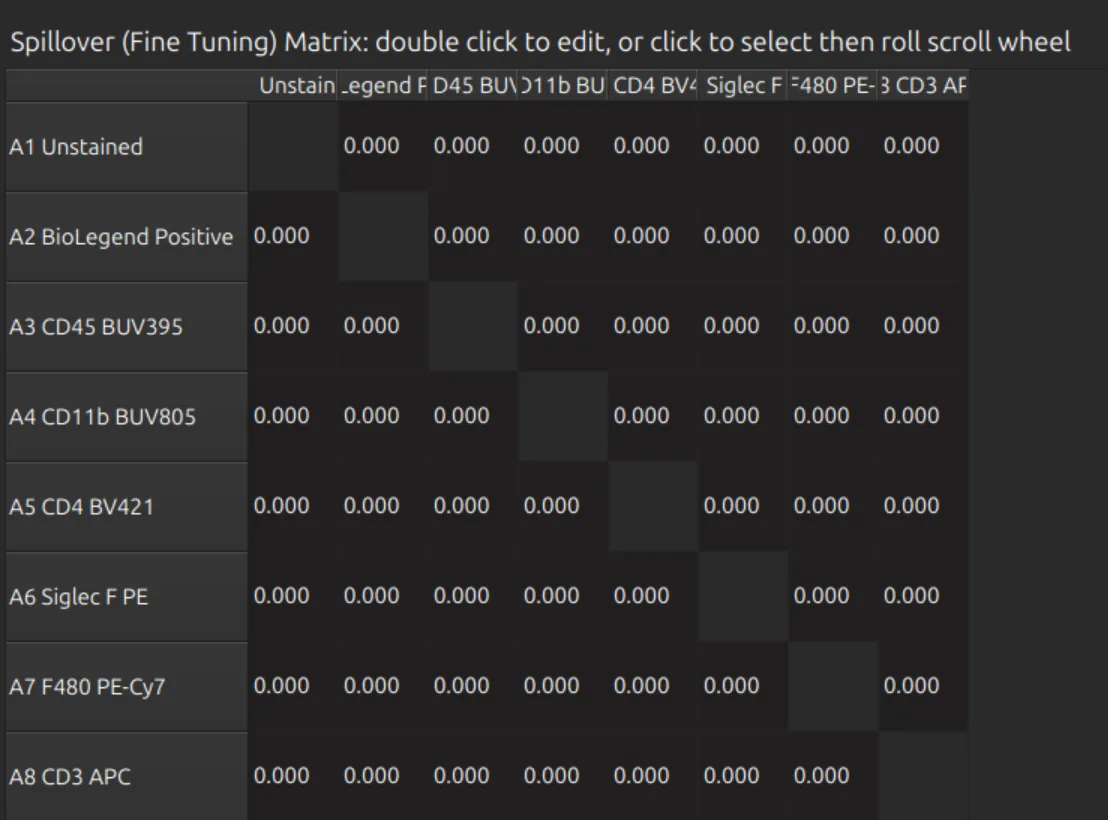
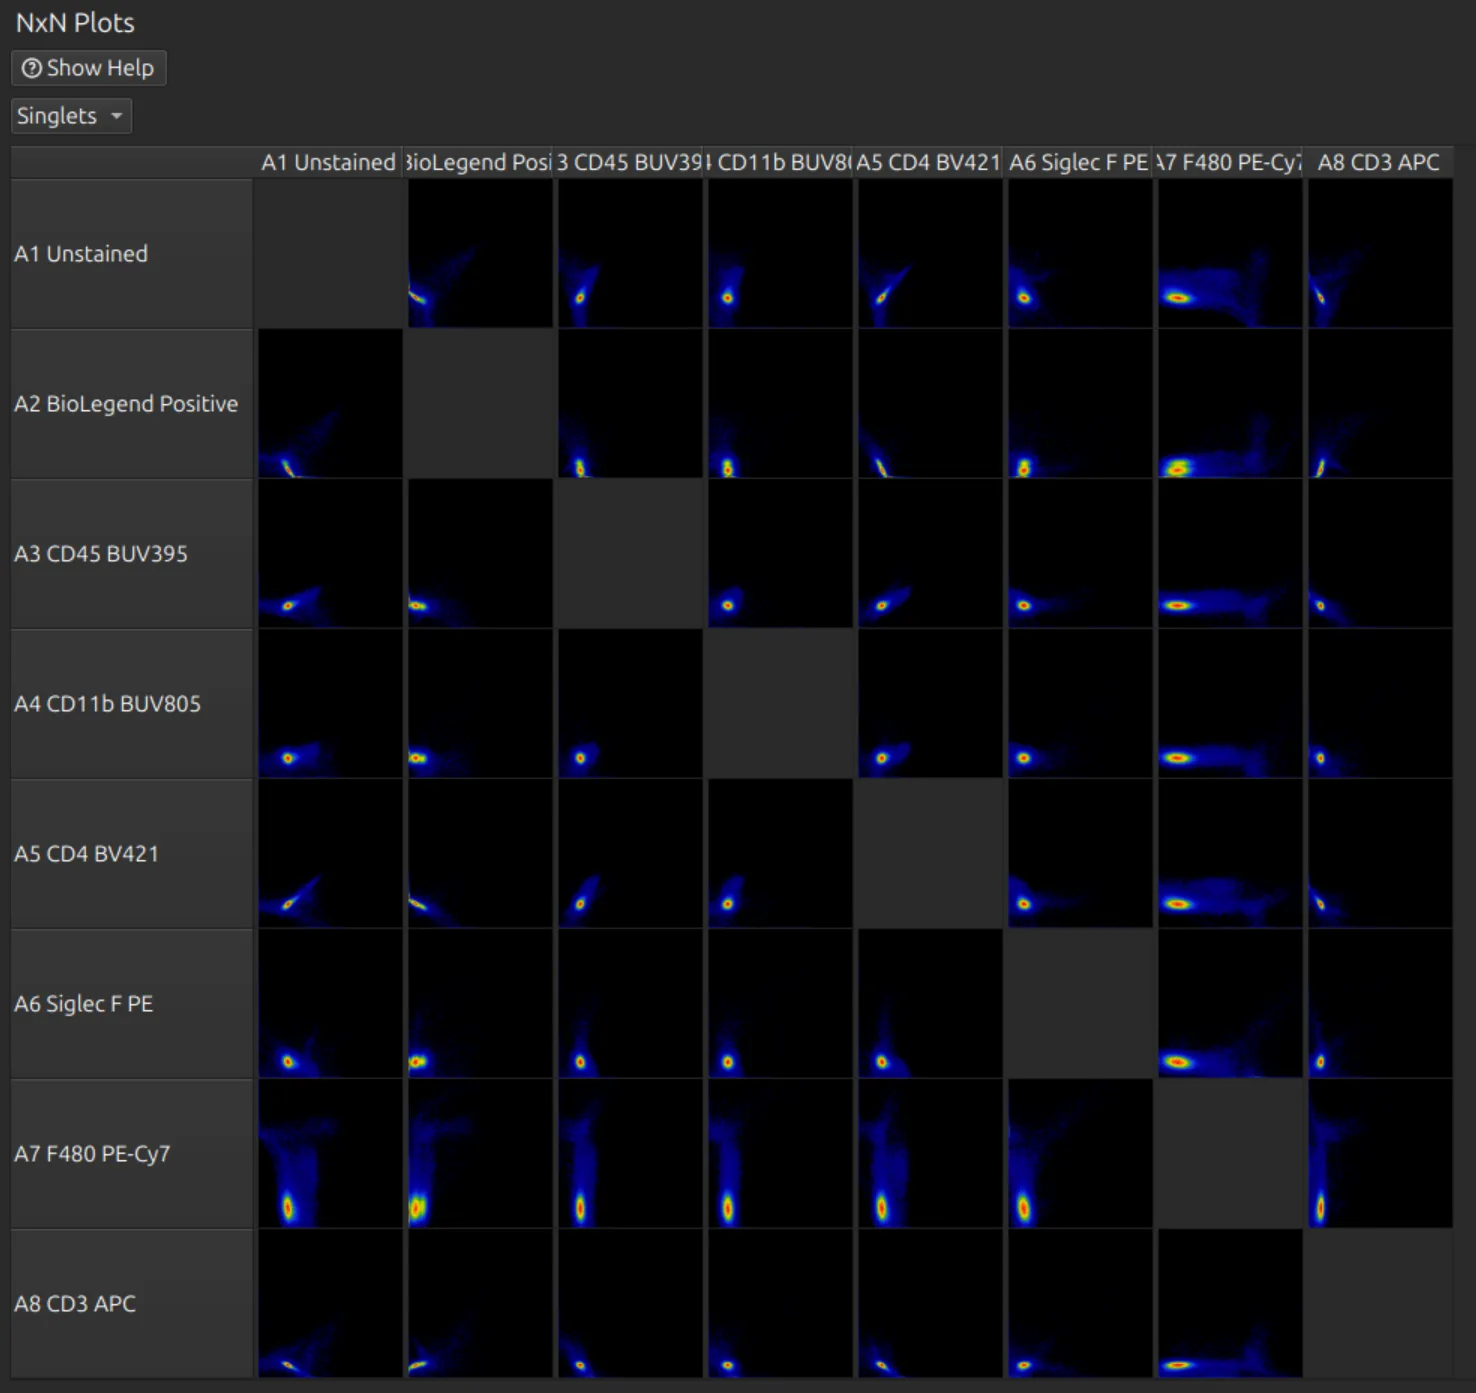
With a large panel, select the labels you are working on first. With nothing selected, every pair is drawn: a 60-colour panel means 1,800 plots at once.
Analyse the unmixed data
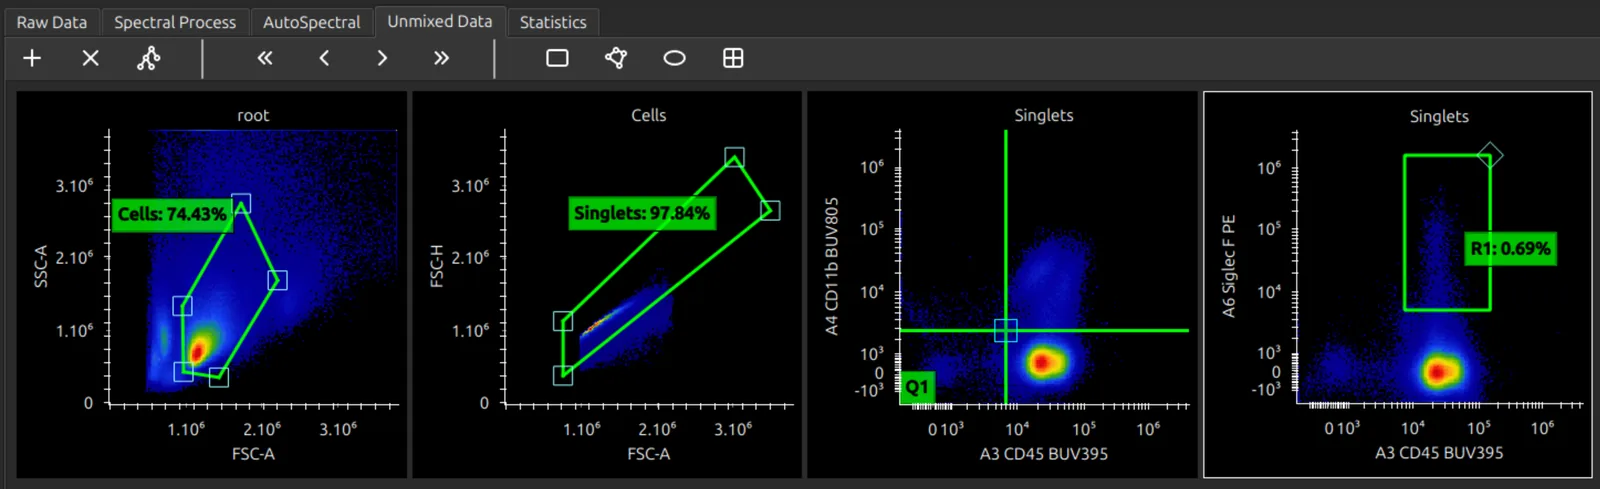
Open the Unmixed Data tab to analyse your unmixed data; see Plots and gates.
Next steps
- AutoSpectral in Honeychrome: clean the controls and remove autofluorescence cell by cell.
- Plots and gates
- Simple Stats and Reports and exports
Further reading
- What’s an Unmixing Matrix? on the Colibri Cytometry blog
- Novo D, Grégori G, Rajwa B. Generalized unmixing model for multispectral flow cytometry utilizing nonsquare compensation matrices. Cytometry A 2013;83(5):508–520. doi:10.1002/cyto.a.22272
- Mage PL, Konecny AJ, Mair F. Measurement and prediction of unmixing-dependent spreading due to collinearity in spectral flow cytometry. Cytometry A 2026;109(6):436–455. doi:10.1002/cyto.a.70044. The similarity and hotspot matrices follow this paper.