
AutoSpectral control cleaning
Measure each fluorophore's spectrum from the right events, so autofluorescence does not end up in your unmixing matrix.
A single-stained control is never only one colour. The brightest events of a cell control include autofluorescent cells, and its dimmest events rarely have the same autofluorescence as the stained ones. Control cleaning chooses the events for each spectrum automatically:
- Saturation exclusion removes events that saturate a detector.
- Brightest-event selection keeps the events with the most fluorophore signal.
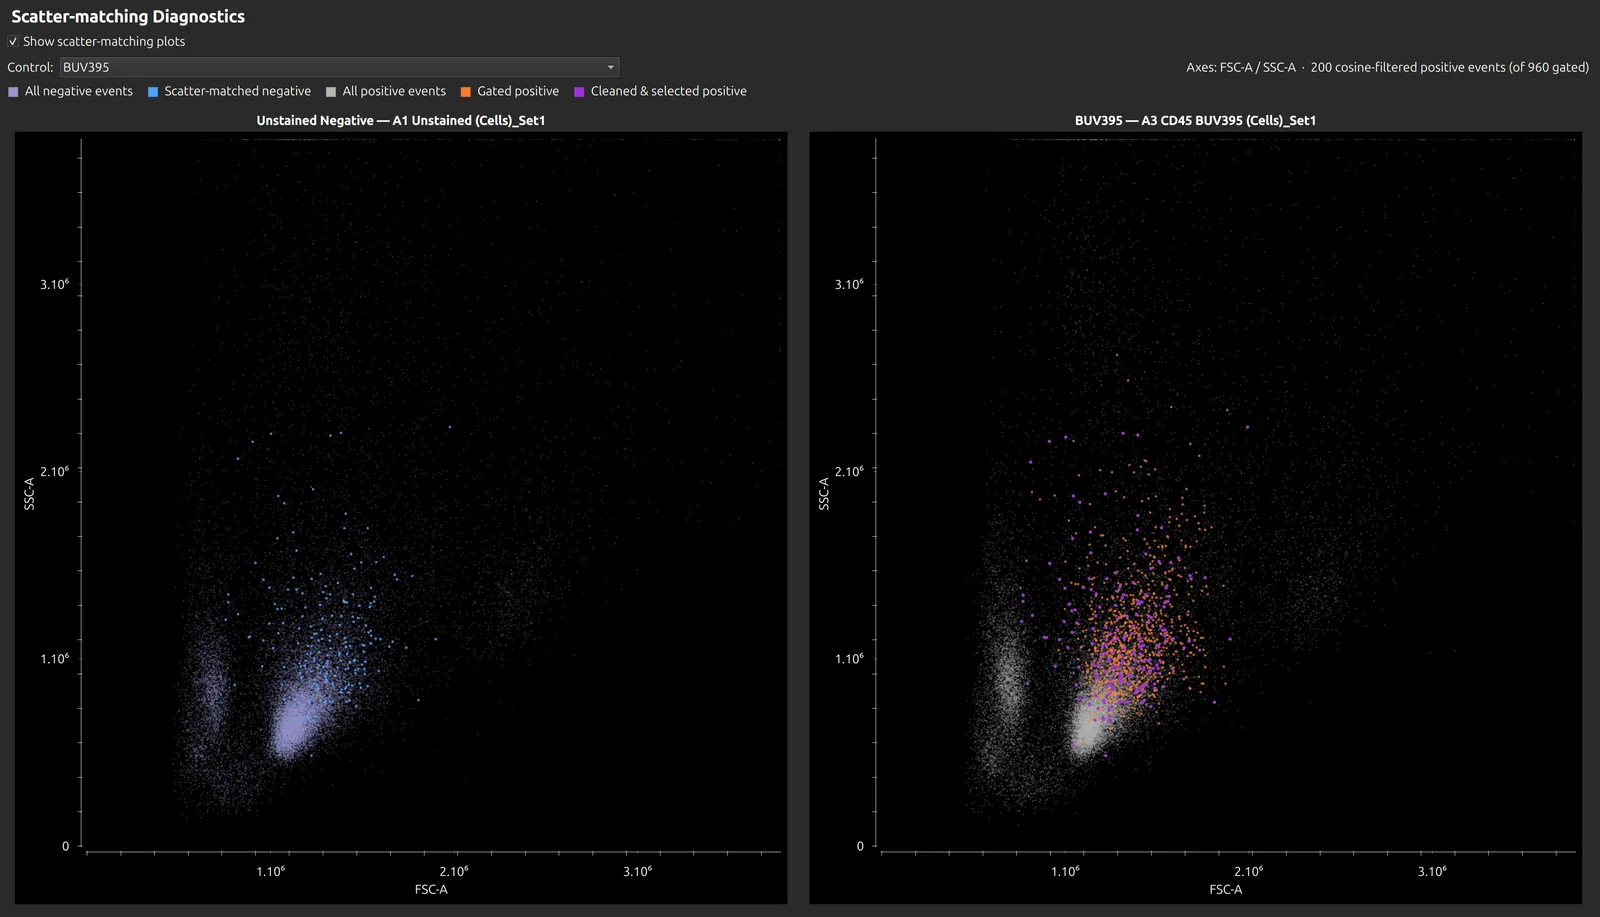
- Scatter matching picks unstained cells with the same forward and side scatter as those positives, so positives and negatives share an autofluorescence background.
- Noise exclusion (optional) removes intrusive autofluorescent events, such as macrophages and dead cells, from the control.
Cleaning is designed for single-stained cell controls on a spectral cytometer. It does less for bead controls, and has not been tested on conventional cytometry.
Before you start
- Unstained samples. You need at least one unstained sample, and preferably one for each tissue or cell type whose autofluorescence differs. Files with “unstained” in the name are recognised automatically. To use another sample, right-click it in the sample browser and choose Mark as Unstained; unstained samples have a blue droplet icon.
- Broad scatter gates. In the Raw Data tab, set wide gates that keep every cell of interest, large and small, but not doublets. Cleaning finds the relevant events inside them.
- Correct particle types. Each control must be marked Cells or Beads, as this decides how scatter matching works. Honeychrome sets this from the file name, or from the scatter when the name does not say; check it in the Particle Type column.
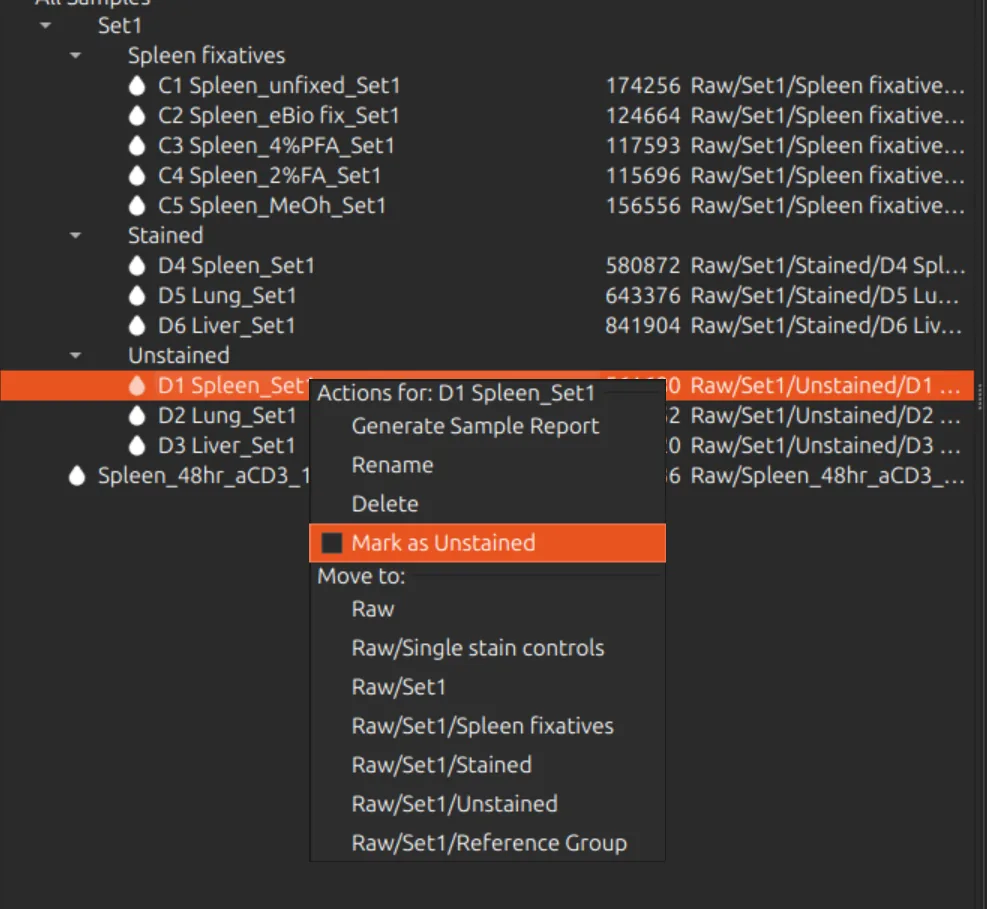
Do not add unstained samples to the spectral model as controls if you intend to use per-cell autofluorescence. Use them only as the negative for the stained controls.
Clean the controls
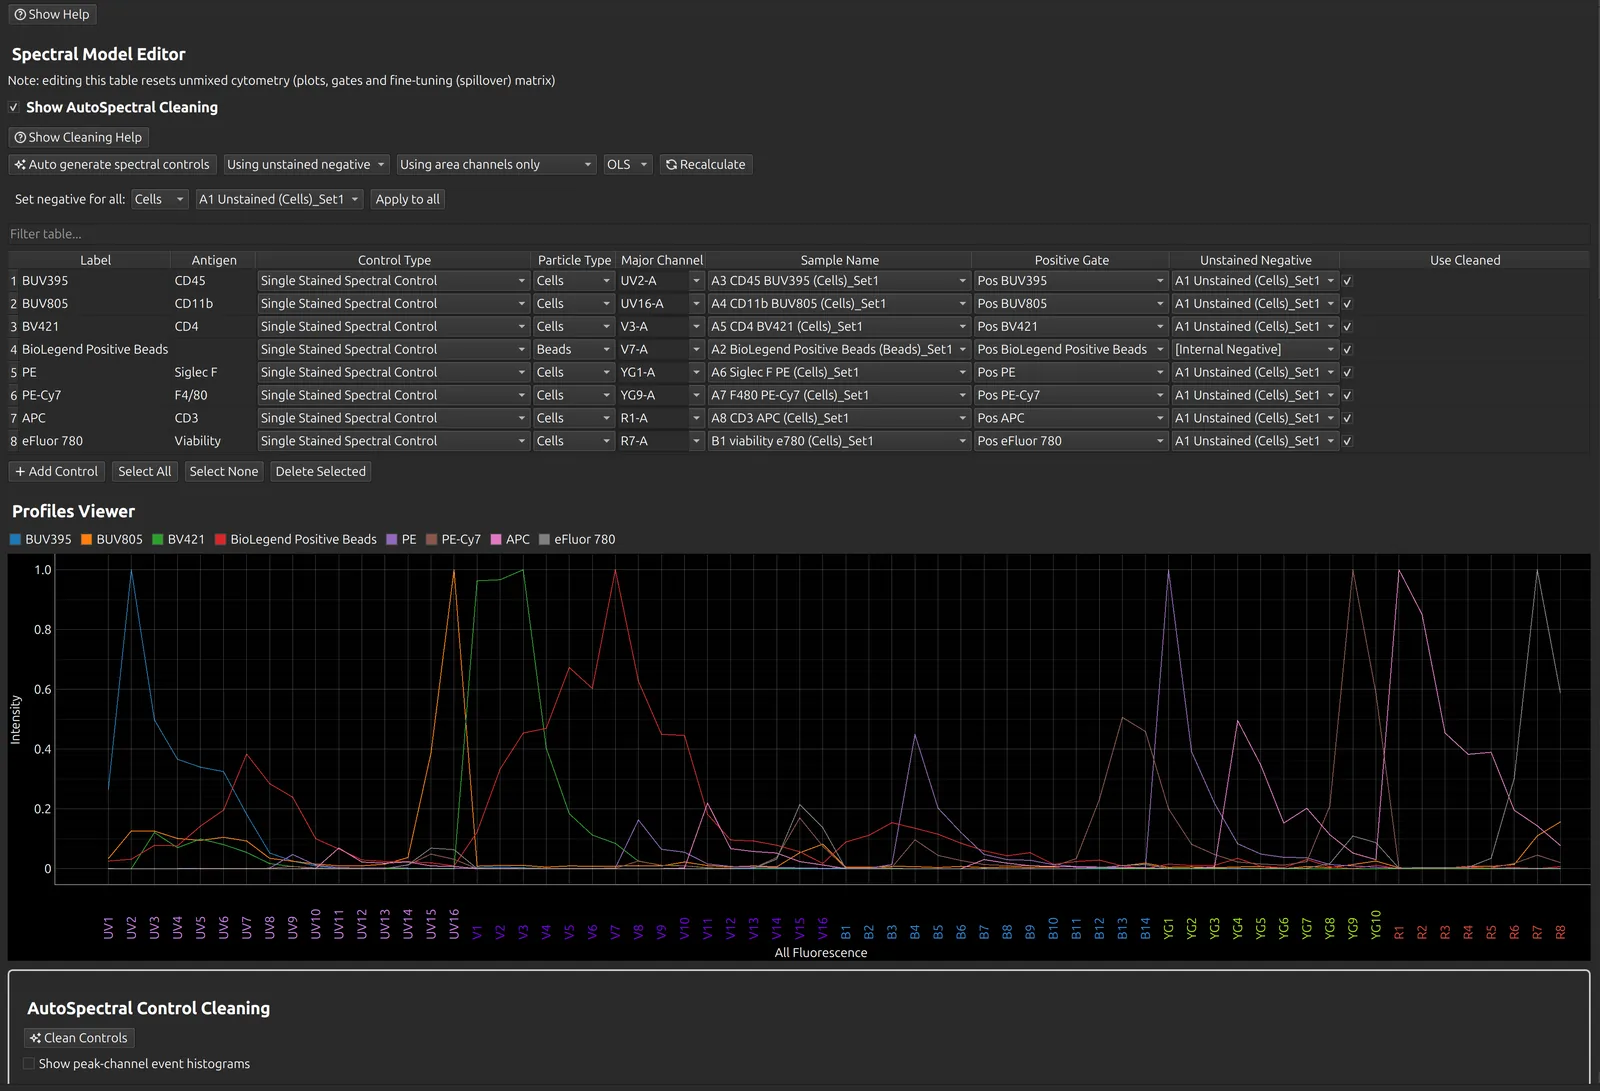
- In the Spectral Process tab, tick Show AutoSpectral Cleaning. The cleaning box and its workflow guide appear, and the spectral model table gains the Use cleaned and Exclude Noise columns.
- Choose Using unstained negative instead of Using internal negatives, and check that each cell control has an unstained sample in its Unstained Negative column. Set negative for all fills the column in one step.
- Press Auto generate spectral controls (see Spectral unmixing). With Automatically Clean ticked, the default, cleaning follows straight on and the spectral model is recalculated once.
- To clean again after changing gates, negatives or particle types, press Clean Controls. Only the controls whose settings changed are cleaned again.
Automatically Clean is saved with each experiment. Its default for new experiments is set in App Configuration.
Exclude Noise is off by default, because controls with little autofluorescence do not need it. Clean once, look at the results, then tick it for the controls with high autofluorescence and clean again.
Check the result
Three diagnostics sit below the spectral model table. Tick one, then click a control in the table.
Peak channel event histograms
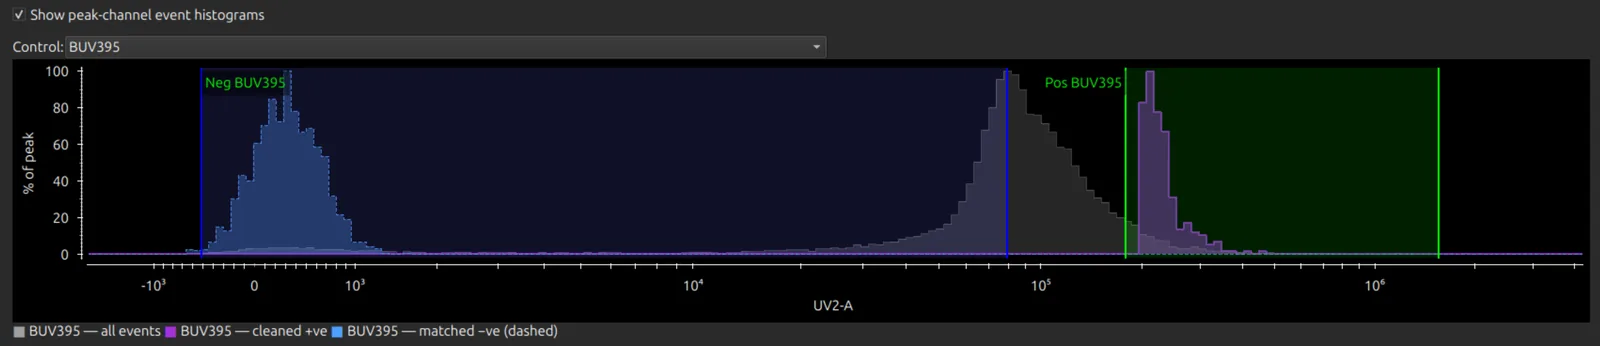
Show peak channel event histograms shows the events kept for the positive and the negative after cleaning, against all the events of that sample. If the positive gate misses the stained population, adjust it in the Raw Data tab and clean again. The positive gate starts on the brightest 5% of events and the negative on the dimmest 25%; both percentages are set in App Configuration.
Scatter-matching plots
Show scatter-matching plots shows the unstained cells chosen to match the positive cells on forward and side scatter.
Spectral QC
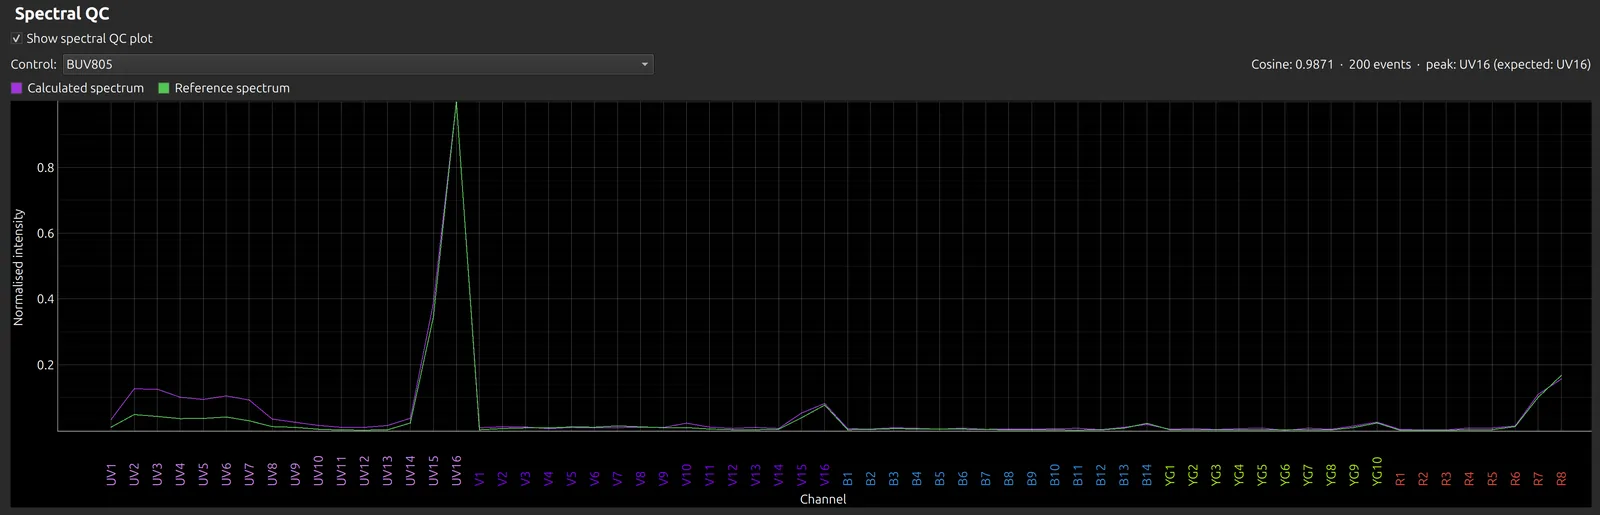
Show spectral QC plot compares a control’s spectrum (purple) with the reference library spectrum for the same fluorophore (green). It shows the cosine similarity, the number of events kept, and the expected and observed peak channels.
Warnings
All the warnings from a run are collected into one message at the end:
- Low cosine similarity: a spectrum is unlike the library spectrum for its fluorophore. Check the control’s label (it must name the fluorophore) and its major channel.
- Looks like background, or weak signal: after cleaning, the control’s positives are hardly brighter than its unstained, and their spectrum is shaped like the unstained autofluorescence. The control probably has no real stain; use a library spectrum instead. This check runs only when the cosine check fails or there is no reference spectrum.
- Few events: too few events survived cleaning for a reliable spectrum.
Use or undo the cleaned spectra
After cleaning, each cleaned control has Use cleaned ticked, and its cleaned spectrum is used. Untick it to go back to the spectrum from the gate means for that control, then press Recalculate.
Then review the spectra, the similarity and hotspot matrices and the NxN plots as usual (see Spectral unmixing), and go on to the Autofluorescence page.
Further reading
- AutoSpectral Cleaning on the Colibri Cytometry blog
- Cleaning in the AutoSpectral package
- Roederer M. Compensation in flow cytometry. Curr Protoc Cytom 2002;Unit 1.14. doi:10.1002/0471142956.cy0114s22